You can quickly navigate to the Dashboard with G then D. See all
keyboard shortcuts.
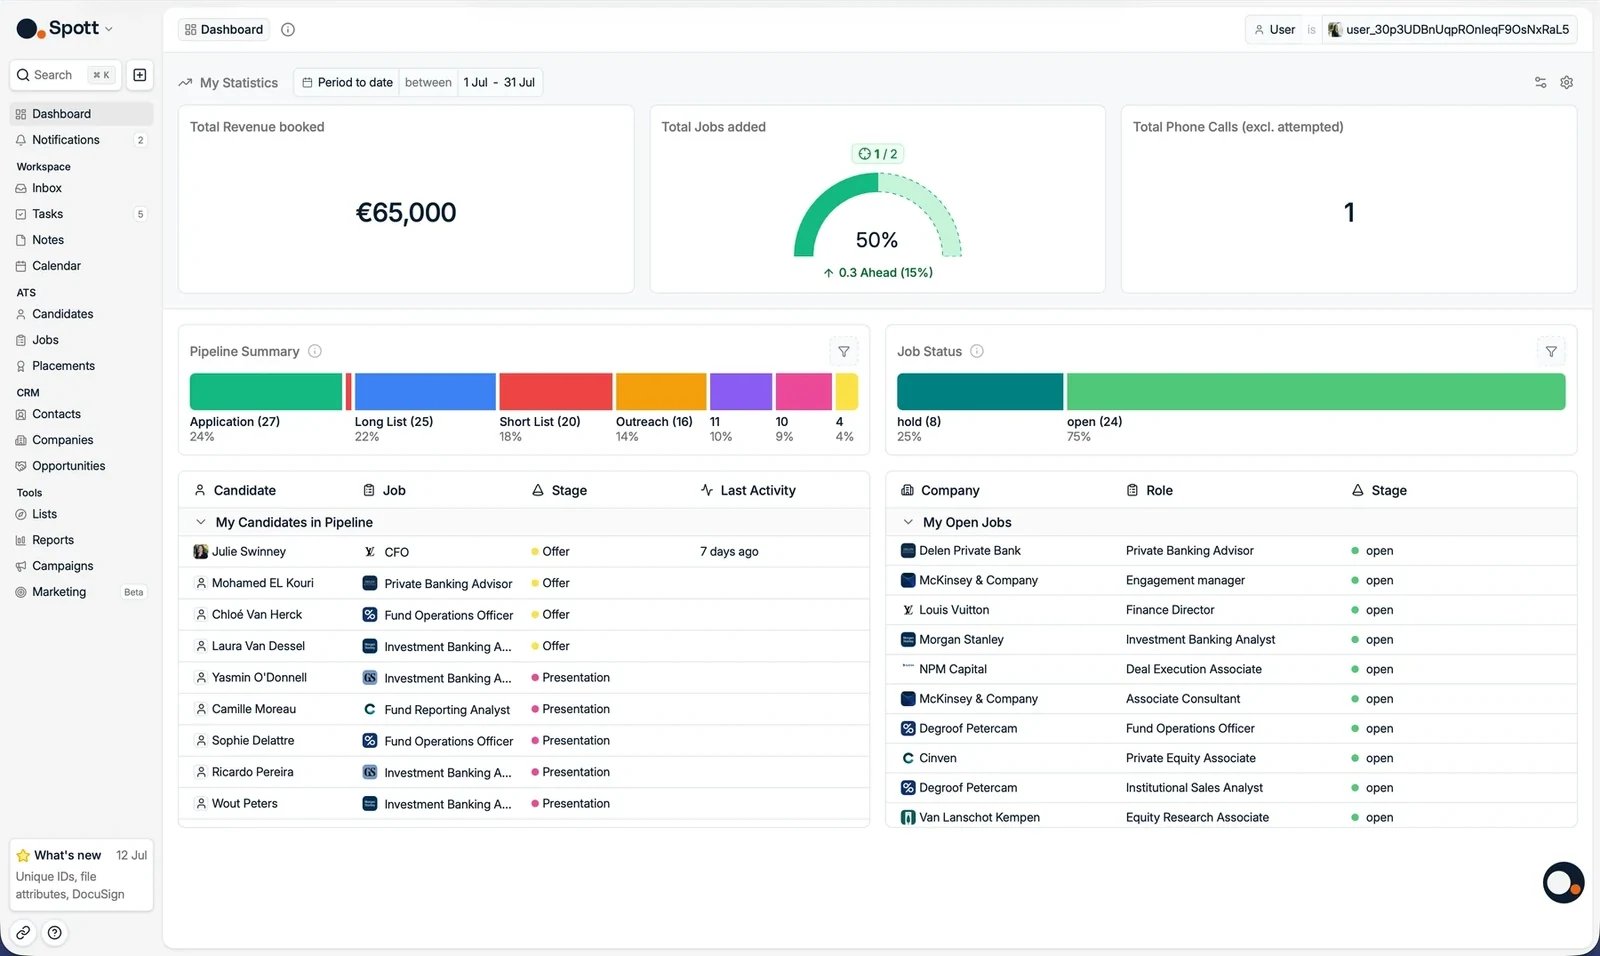
The Dashboard gives you a real-time snapshot of your recruitment activity, from
revenue and calls to open jobs and candidate progress. It is your personal home
screen when opening Spott.
My Statistics
Use the user filter to choose whose numbers you see (you or teammates) and the
time period filter on the top right to set the reporting period (for example
This week, This month, This quarter, or a custom range).
The metric cards show key performance numbers for the period. Open Configure
Dashboard to choose which metrics appear and drag them into the order you want. The
available metrics are:
- Total Revenue booked, Total Placements added
- Total Jobs added, Total Candidates added
- Total Phone Calls (excl. attempted), Total Outbound Calls
- Total Online Meetings, Total In-person Meetings
- Total CVs sent, Total Standard CVs sent, Total Speculative CVs sent
- Total 1st Interviews, Total 1st Standard Interviews,
Total 1st Speculative Interviews
- CV Sent Fill Rate, 1st Interview Fill Rate
Configure Dashboard is workspace-wide: the metrics you turn on or off affect
everybody’s dashboards, not just your own.
The Dashboard metrics are a fixed set. If you want to count something the cards
do not cover, for example notes with a specific label, build a custom insight in
Reports. Pipeline Summary and Job Status
- Pipeline Summary shows the applications you own, per stage.
- Job Status shows the jobs you are on the team of, broken down by status.
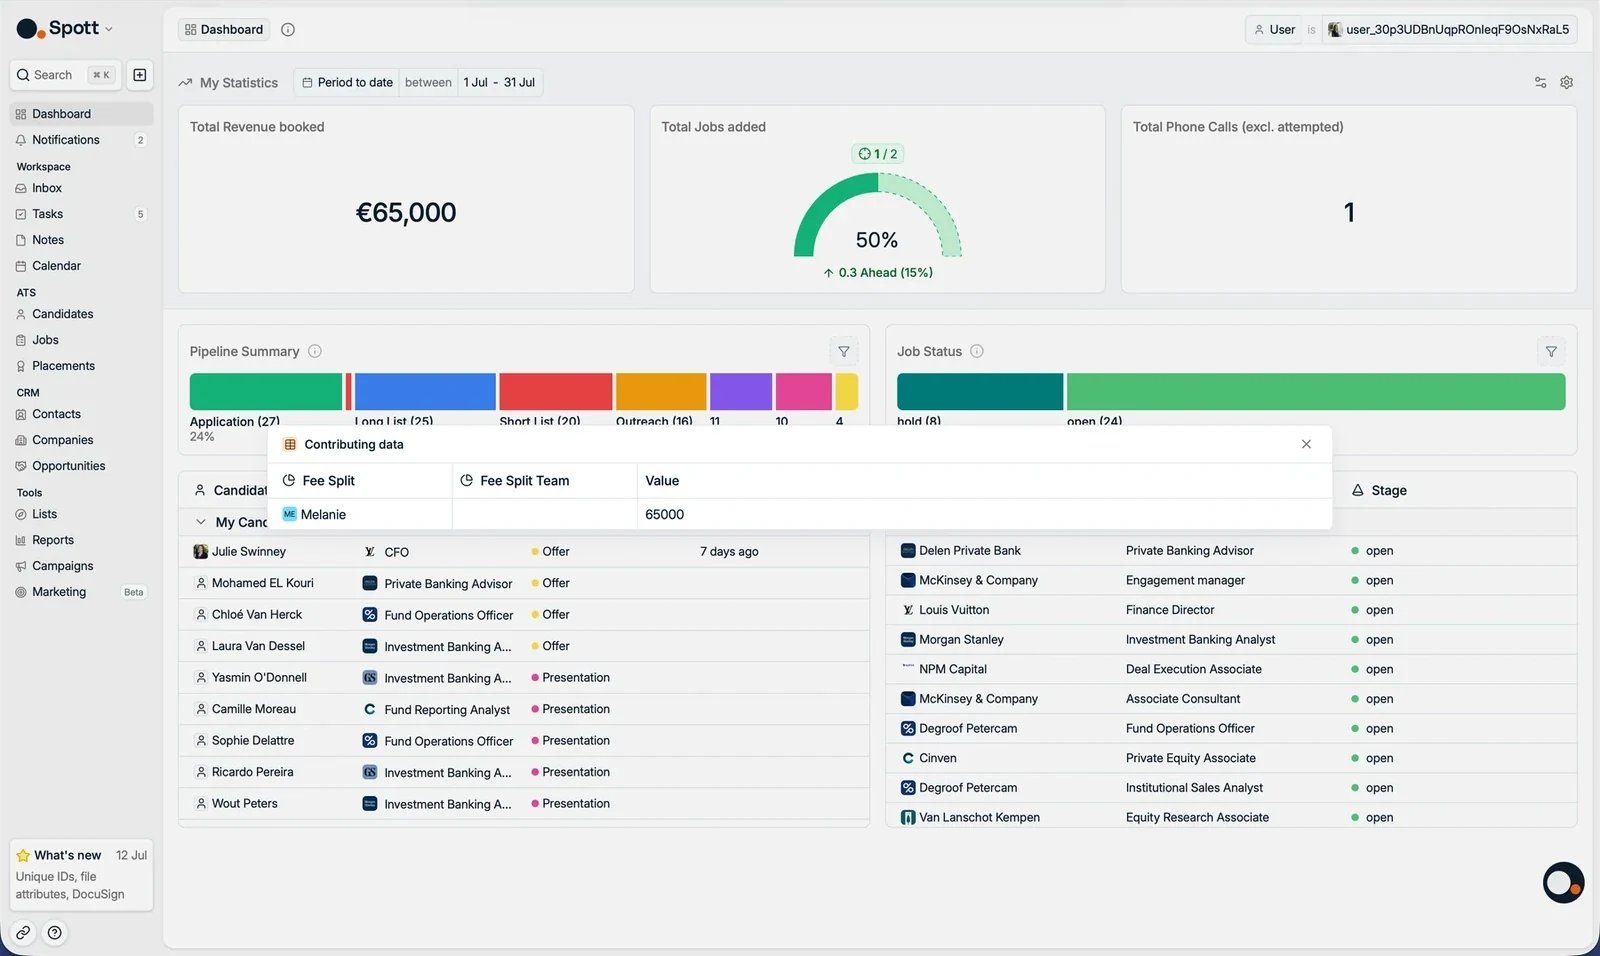
Both are clickable: select a stage to see who is behind the number.
My Candidates in Pipeline
Summarizes all candidates you are currently managing across job stages. Each row
shows the candidate, the job and client, and the current stage. Click a row to open
the application.
My Open Jobs
Lists the active positions you own or collaborate on. Click a job to go to its
record.
The Dashboard updates in real time as you log calls, add candidates, or move them
through stages.