

In this section you learn how to read your recruitment activity, review your pipeline and
open jobs, set performance targets, and find records from the home dashboard.
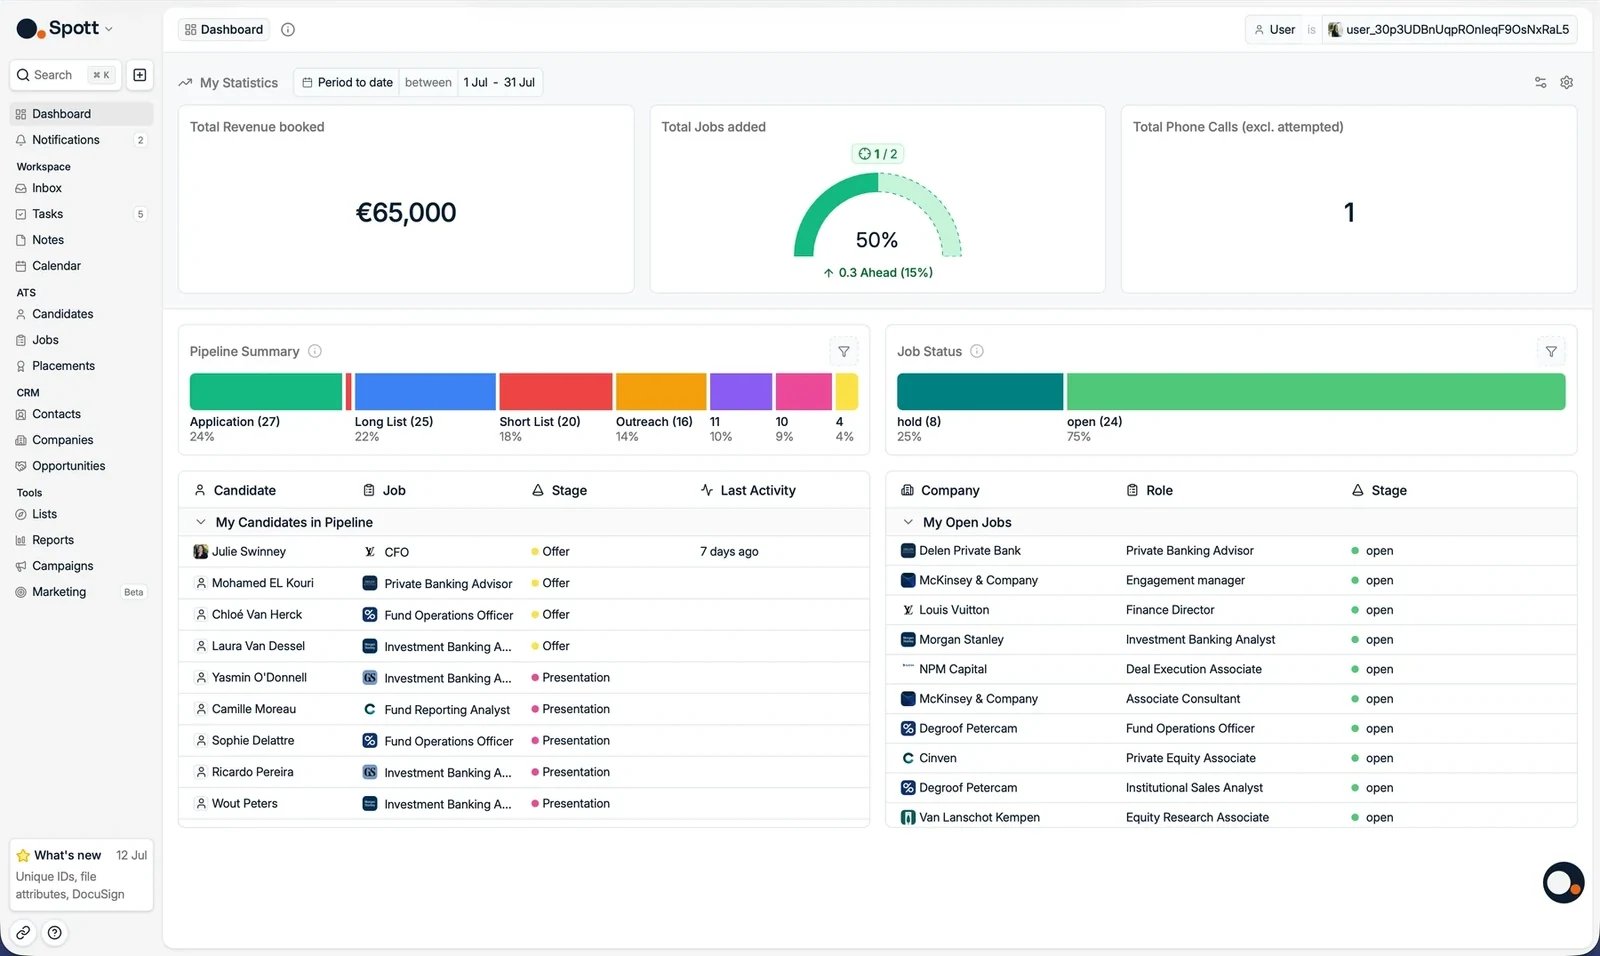
The dashboard is your personal home screen when you open Spott. It gives you a real-time
snapshot of your recruitment activity, from revenue and calls to open jobs and candidate
progress. If you are elsewhere in the platform, click Dashboard at the top of the
left-hand navigation bar, or use the two-key shortcut: press G, then D.
1. Understand your performance
The My statistics area gives you a real-time view of recruitment activity for the period and the people you select.1.1 Choose whose activity and which period to review
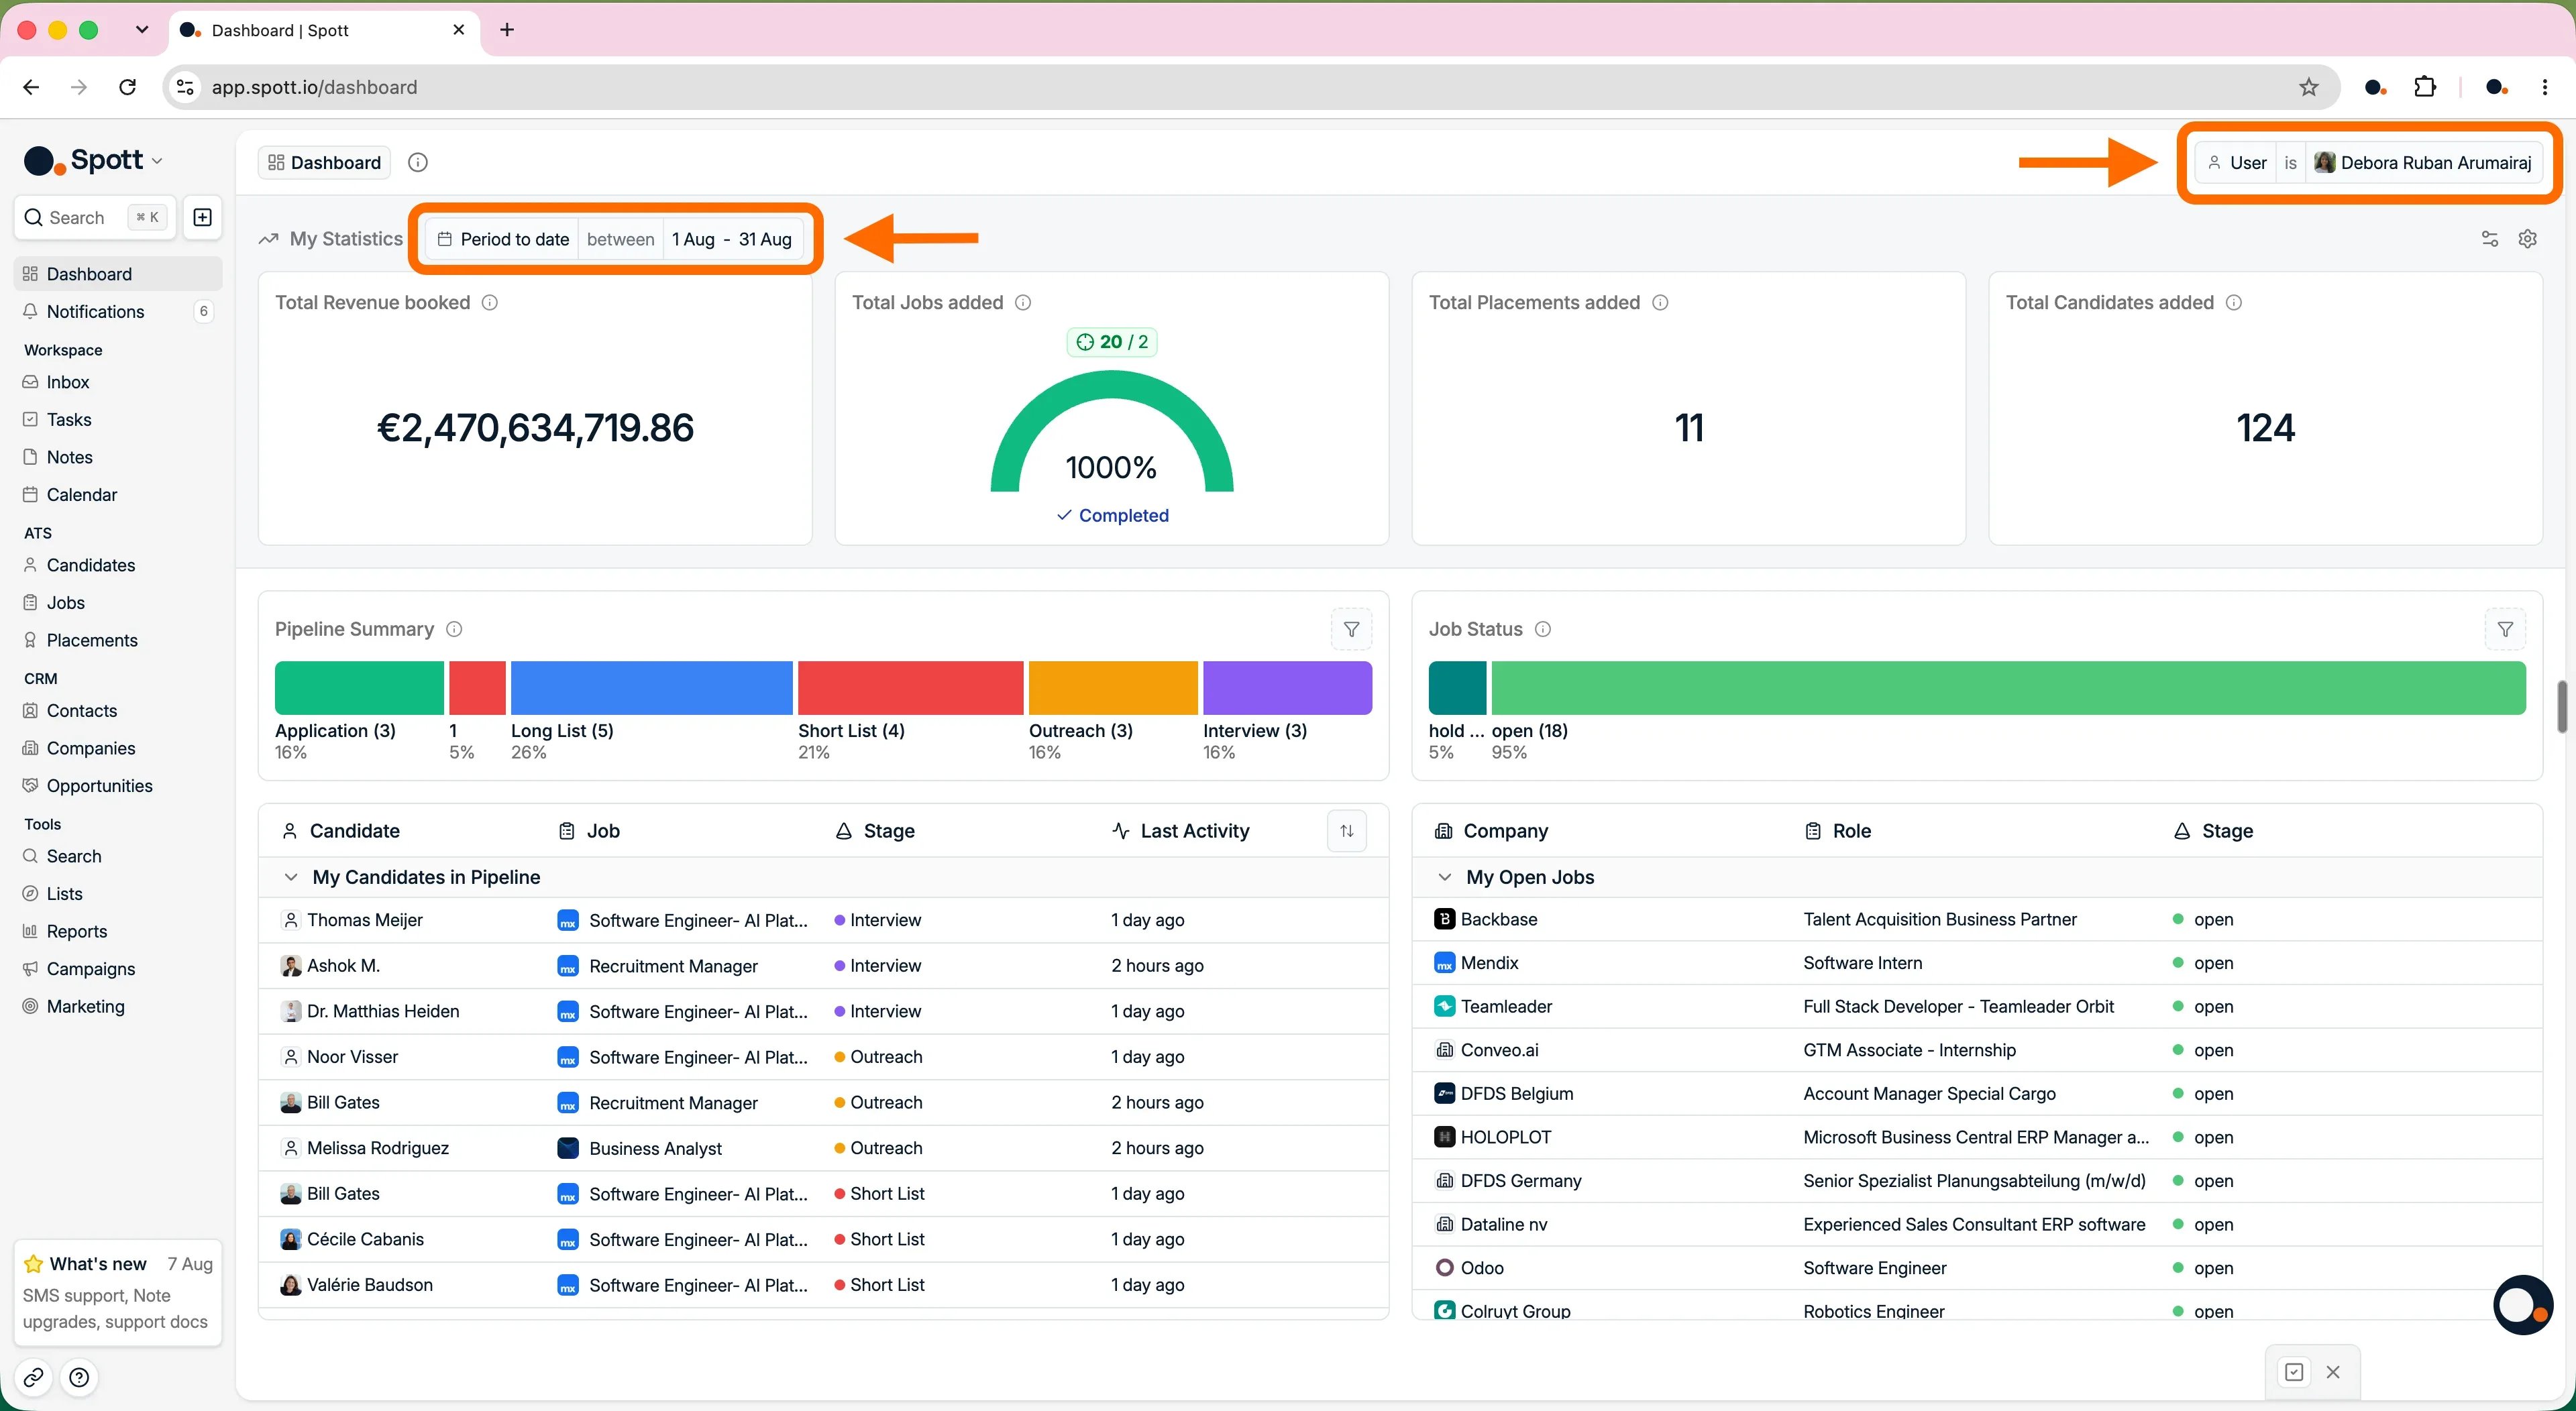
Use the time period filter in the top right corner to review figures for this week, this month, this quarter, or a custom date range. If you have permission to manage analytics, use the user filter to switch between your own activity, a teammate, or a team.Without permission to manage analytics the user filter does not appear, and the
dashboard shows only your own figures.
1.2 Choose which metrics appear
Open Configure Dashboard from the gear icon to choose the metric cards shown at the top of the dashboard. Drag the cards into the order that makes the most sense for your team.Available metrics
Available metrics
- Revenue and hiring: total revenue booked, total placements added, total jobs added, and total candidates added.
- Calls and meetings: total phone calls excluding attempted calls, total outbound calls, total online meetings, and total in-person meetings.
- CV activity: total CVs sent, total standard CVs sent, and total speculative CVs sent. These totals are mapped to stages in the settings.
- Interview activity: total 1st interviews, total 1st standard interviews, and total 1st speculative interviews.
- Conversion: CV sent fill rate and 1st interview fill rate.
1.3 Set targets and track progress
Open Configure Targets to set a goal per user and per metric. The target grid has one row per teammate and one column per metric. Leave a cell at 0 when that target does not apply to someone. Choose the time window for targets, for example Every month, to define the period each target covers. Metric cards then show actual performance against the goal for the dashboard period you are looking at.1.4 Open the records behind a number
Click any metric card to see the records included in its total. Click Total Revenue booked, for example, to review the fee split behind that figure.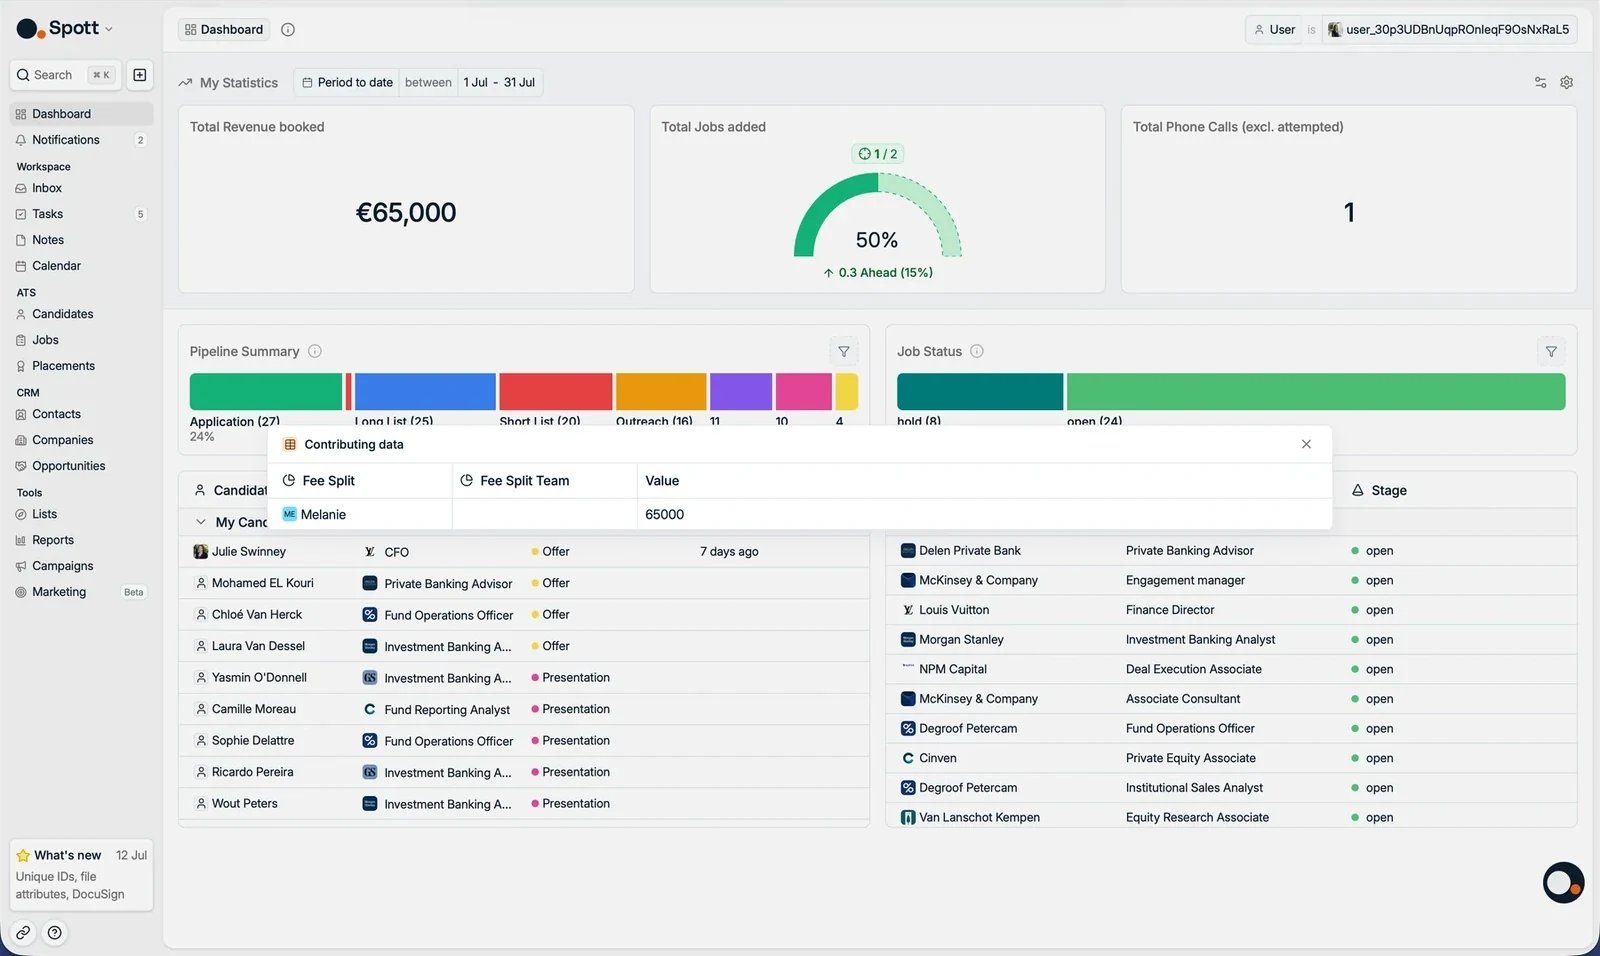
Dashboard metrics are a fixed set. To measure something these cards do not cover, build
a custom insight in Reports, or see
building reports for the full builder.
2. Review your current pipeline and open work
The lower part of the dashboard shows what is moving through your pipeline, and lets you open the applications, candidates, and jobs behind it.2.1 Check Pipeline summary and Job status
Use these two panels to understand the volume behind each stage or status:- Pipeline summary shows the applications you own in each pipeline stage. Sort the panel to put the stages you use most at the top, then click a stage to see the applications behind its total.
- Job status shows the jobs you are a team member on, grouped by status. Click a status to see the jobs behind its total.
2.2 Open a candidate from My candidates in pipeline
Use My candidates in pipeline to review the candidates you are managing across active job stages. Each row shows the candidate, job, client, current stage, and recent activity. Click a row to open the application.2.3 Open a job from My open jobs
Use My open jobs to review the active roles you own or collaborate on. Click a job to open its record and carry on working on it.The dashboard updates in real time as you log calls, add candidates, or move applications
through stages.
3. Find a record with global search
Global search opens a record directly when you already know who or what you need.3.1 Search from anywhere
Click Search in the top left corner, or press⌘K / Ctrl+K. See
global search for everything it matches. You can search for:
- People and organisations: candidates, contacts, and companies by name.
- Contact details: phone numbers and email addresses.
- Unique identifiers: any supported record by its record ID, once an admin has switched on Show Record IDs under Settings → Features → Workspace. The ID then appears in the top right of a record, and Copy gives you the full version to paste into search.
Dashboard reference
Every card on the dashboard, the targets, the drill-downs, and who can see what.
Keyboard shortcuts
The two-key jumps like G then D, and the rest of them.
Now your turn
- Open one candidate from My candidates in pipeline
- Use the global search bar to find a record
- Set a target on one metric and check how you are tracking
Next: inbox and calendar
Email and meetings, in one place.