

In this section you learn how to find and read reports, build insights from live workspace
data, filter and group the results, and investigate the records behind each metric.
1. Find and read reports
The Reports area gives you reusable views of recruitment performance, from pipeline conversion and activity to placements and revenue.1.1 Start from the Reports overview
Open Reports to add a New report, or to see the reports you already have. The overview separates them into:- Your reports: reports visible only to you.
- Workspace: reports visible to everyone in the workspace.
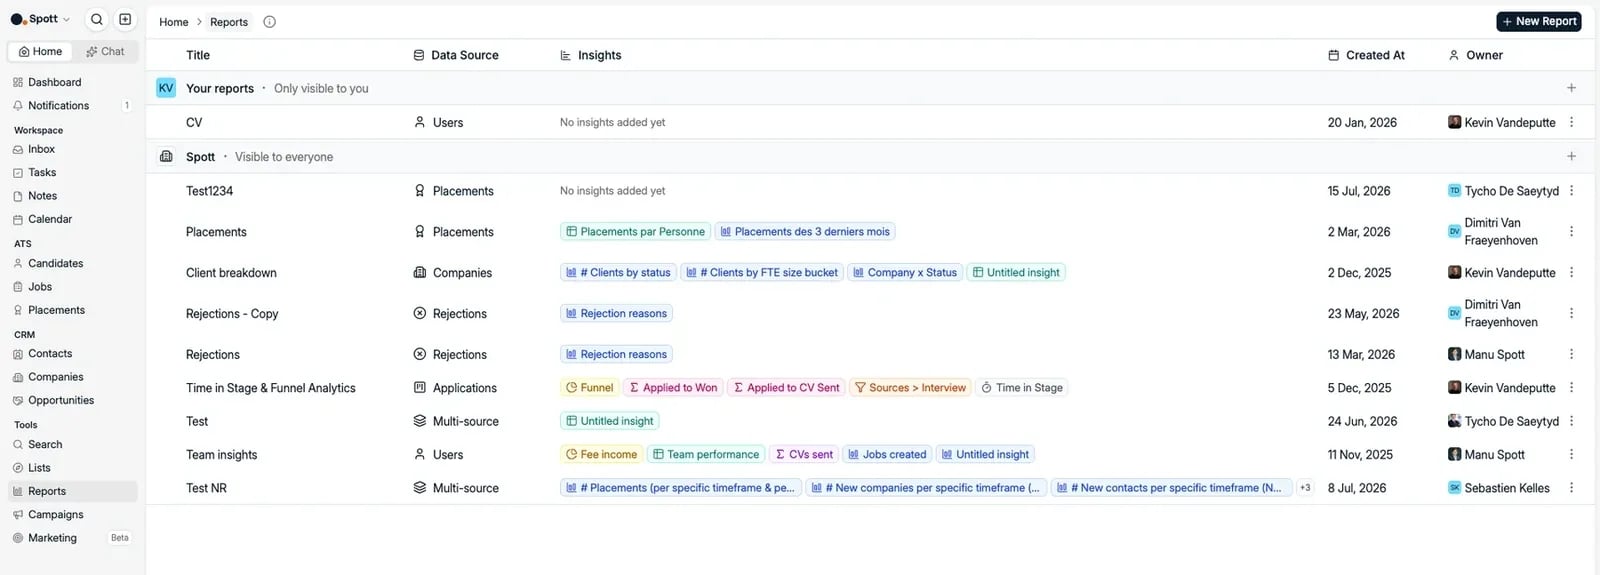
- Client breakdown: review company data and the shape of your client base.
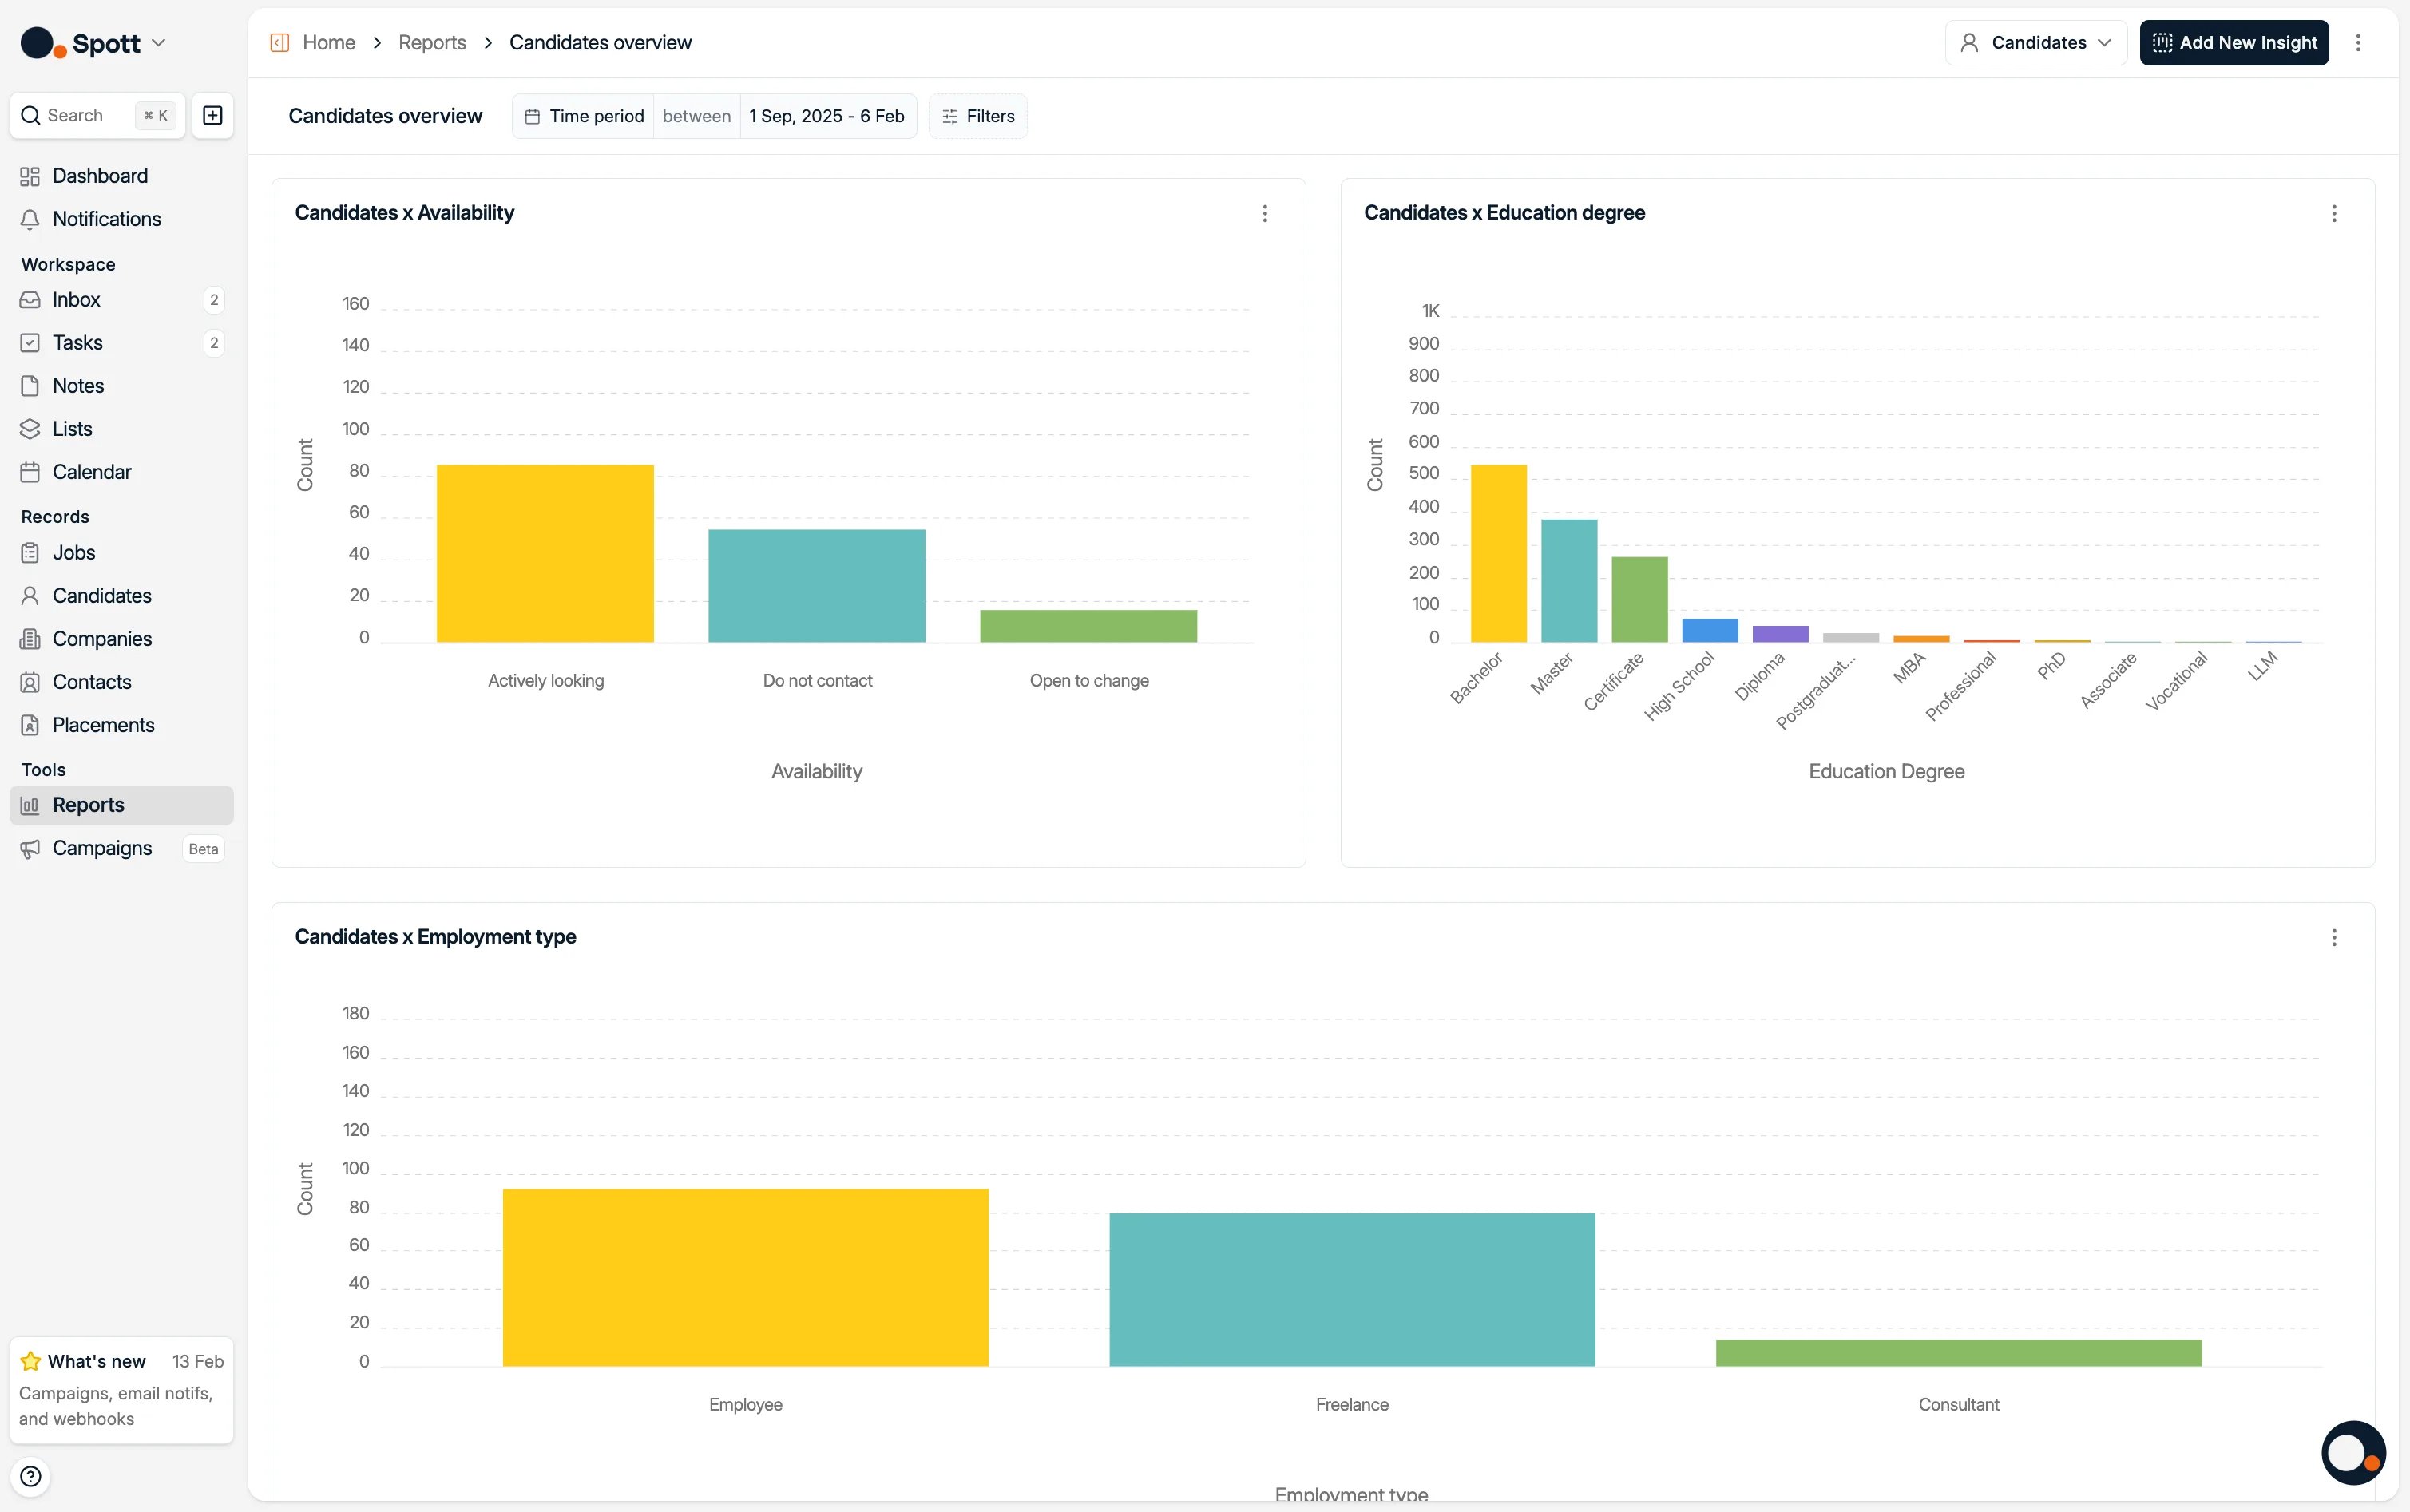
- Candidates overview: understand candidate composition and availability.
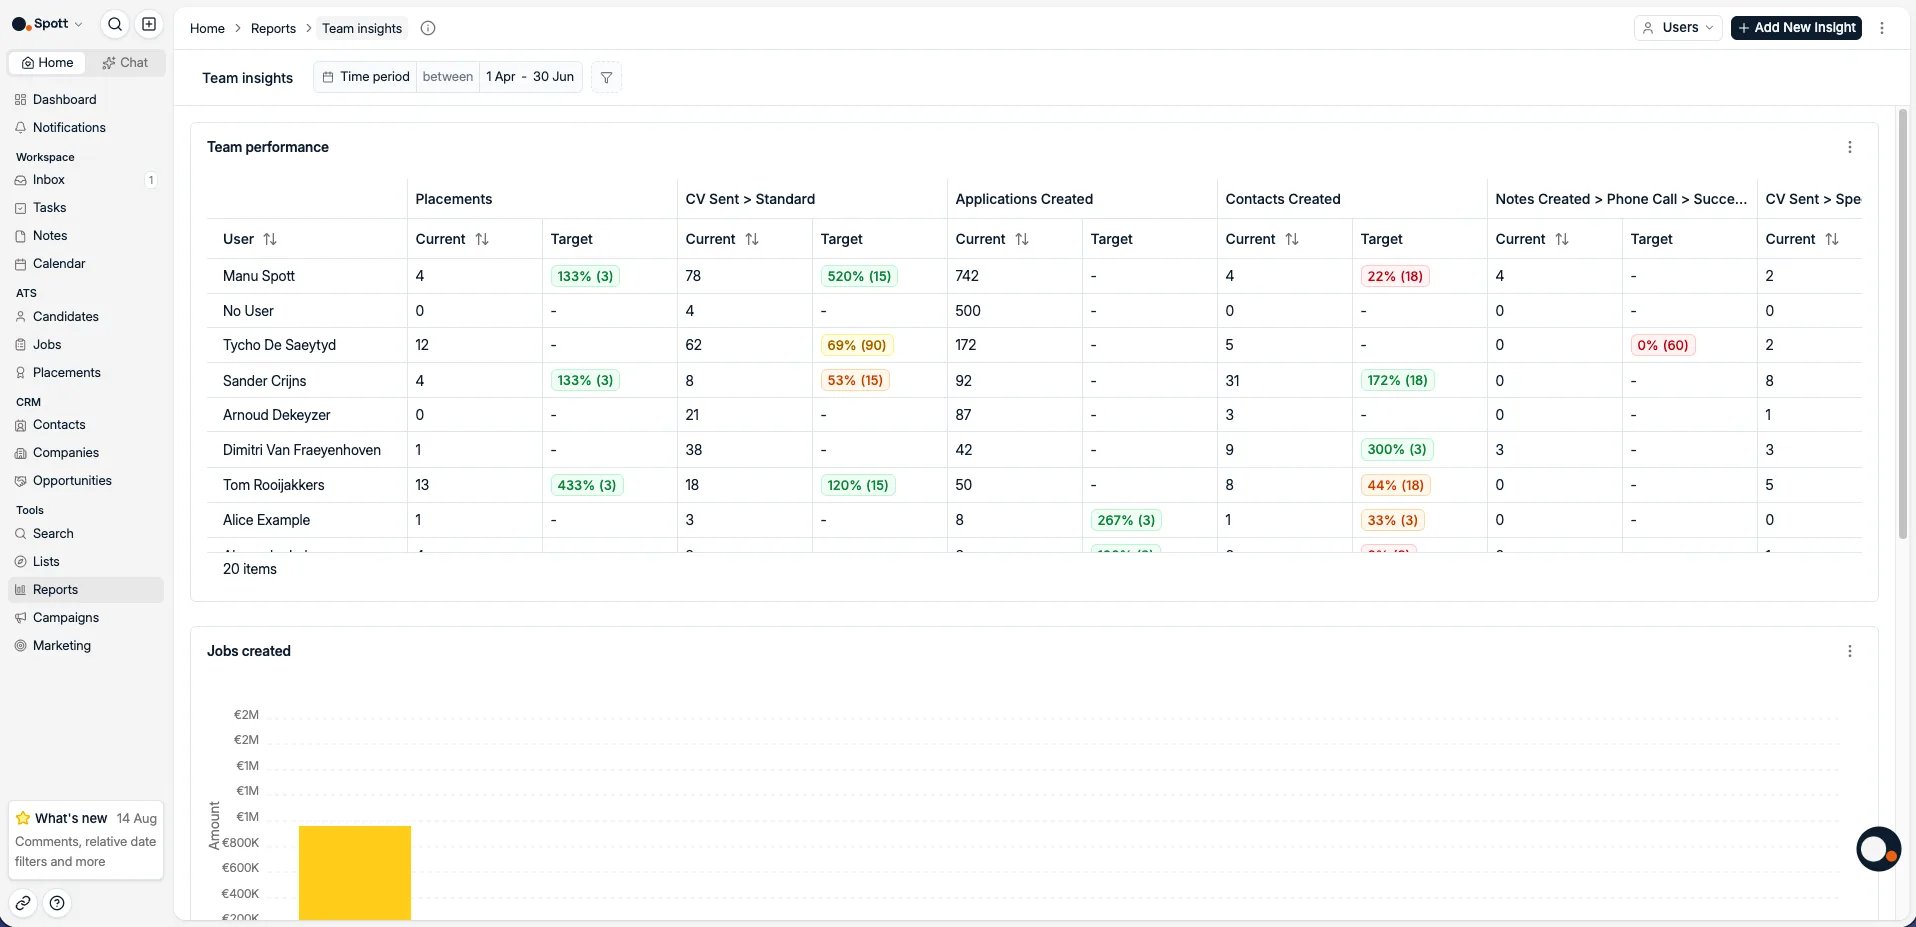
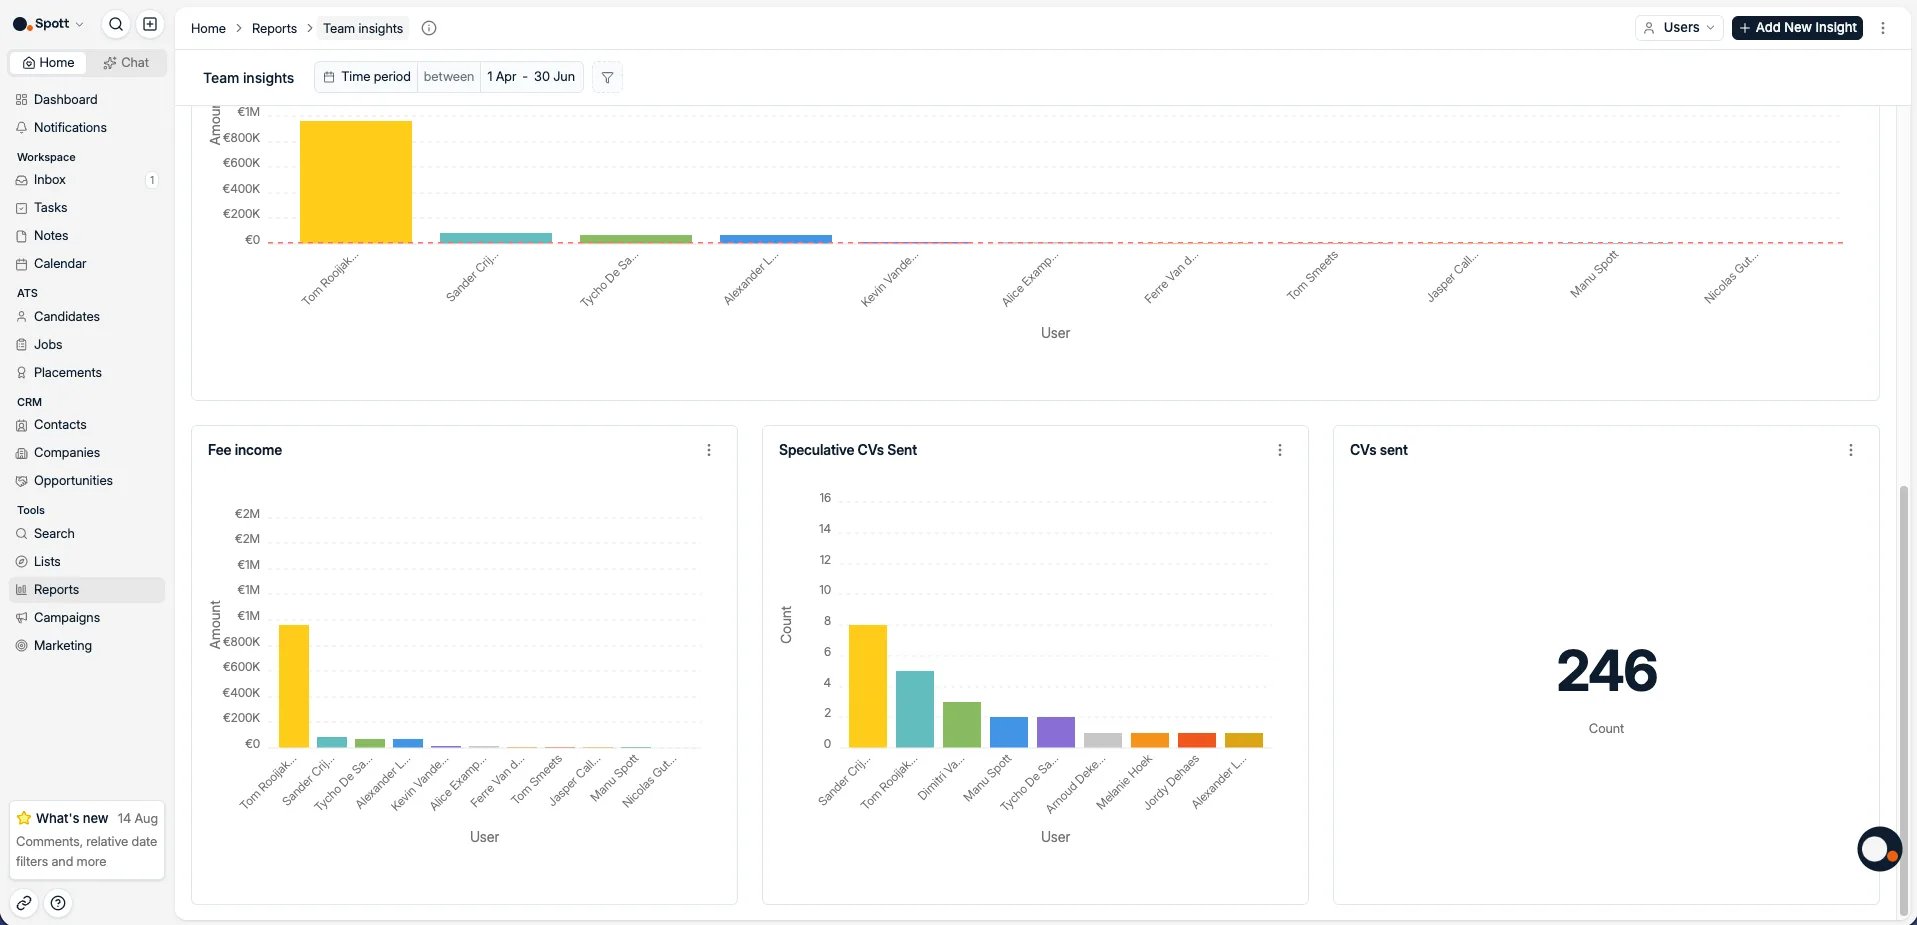
- Team performance: compare activity, fee income, and performance across users.
There is no team-only sharing level between private and workspace-wide reports. Who can
view, manage, and export reports is controlled by role under Settings → Security.
1.2 Read a report and investigate its numbers
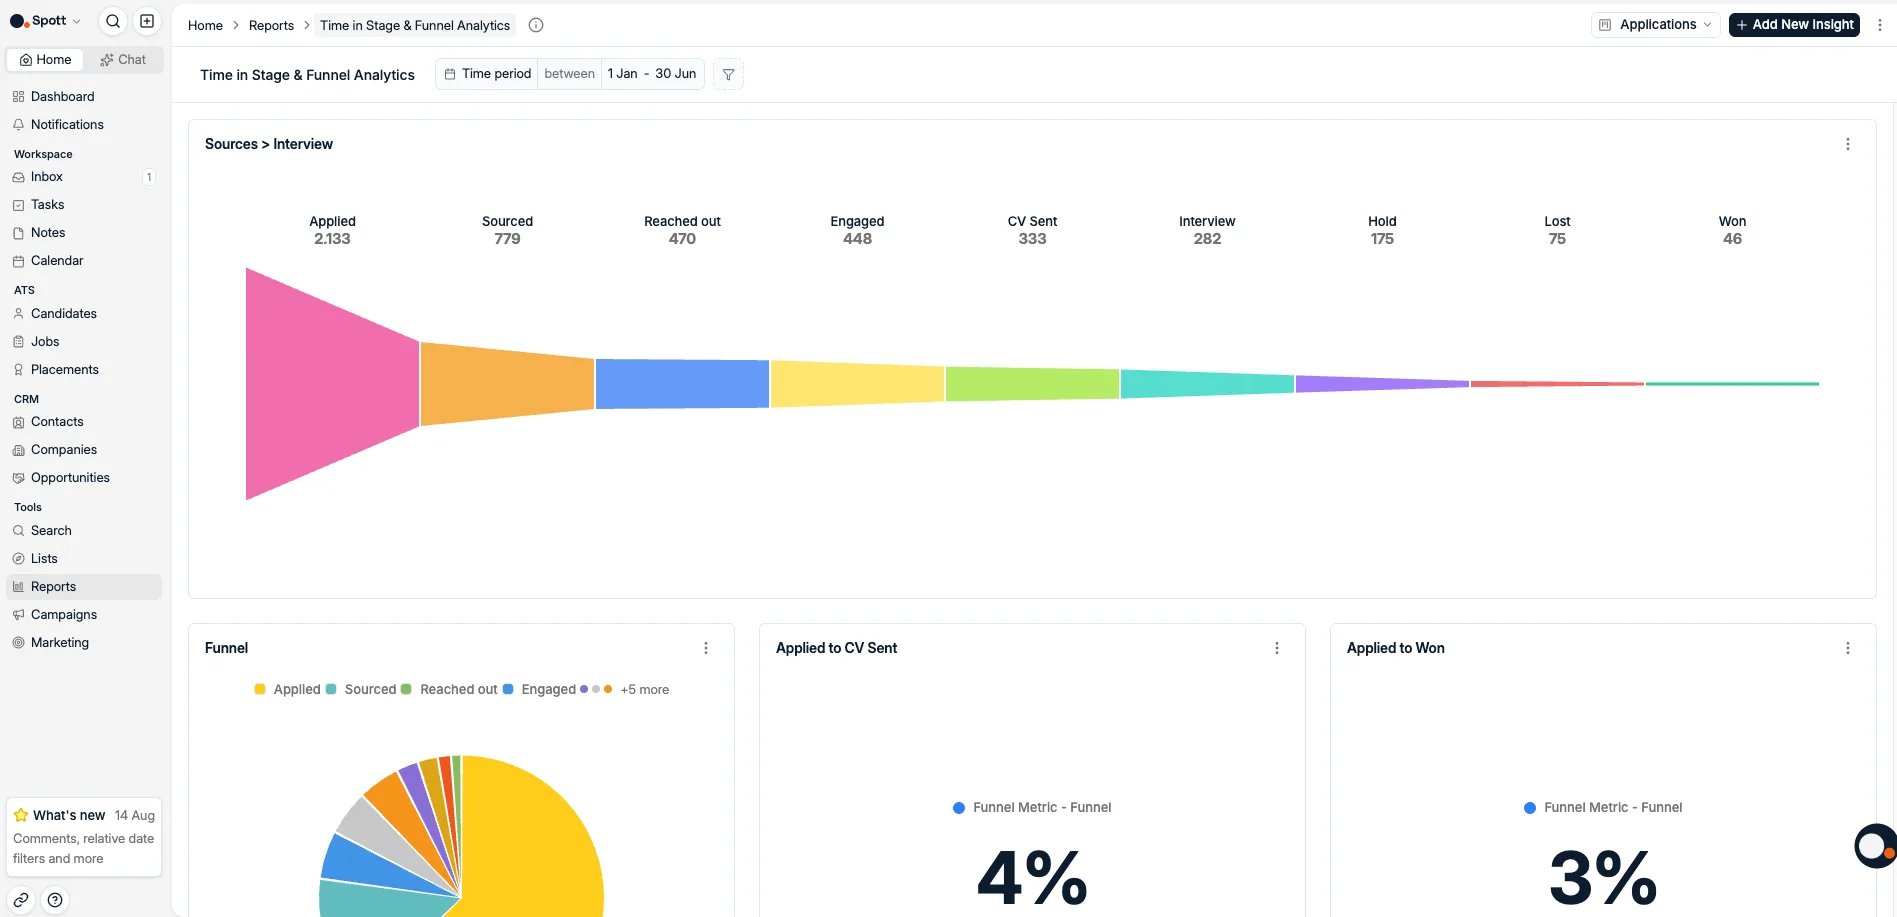
Click a report to open it. Each report contains one or more insights, and each insight answers a specific question using live workspace data. Use the Time period selector to choose7D, 1M, 3M, 6M, 12M, All, or a custom
date range. That period applies across every insight in the report.
Click a number or a chart value to open the records behind it. This drilldown lets you check
exactly which candidates, jobs, applications, or other records make up the metric.
2. Build and customise a report
A report is built from insights. For each insight, choose the records to analyse, what to measure, and how Spott should display the result.2.1 Create a report and add an insight
From the Reports overview, click New report, then Add new insight to build its first visualisation. Give the insight a clear title. As you configure it in the panel on the right, the left side previews the result using your live data. Click Save chart when the insight is ready.2.2 Choose the right data source
The Data source decides which records the insight can count, filter, and group.- Recruitment records: choose Candidates, Jobs, Applications, Companies, Opportunities, Contacts, Users, Notes, Placements, or Rejections when the question concerns one type of record.
- Interactions: use this for recorded touchpoints such as emails, WhatsApp messages, phone calls, and calendar meetings. For outbound email it counts sent messages. Marketing campaign opens and clicks are reviewed in Marketing.
- Multi-source: combine several record types when one source cannot answer the question on its own.
2.3 Choose an insight type and visualisation
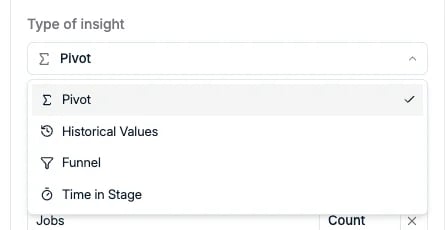
The insight type controls how Spott measures the selected data:- Pivot: break a metric down by another field, such as jobs per stage, company, or team member.
- Historical values: track how a metric changes over time.
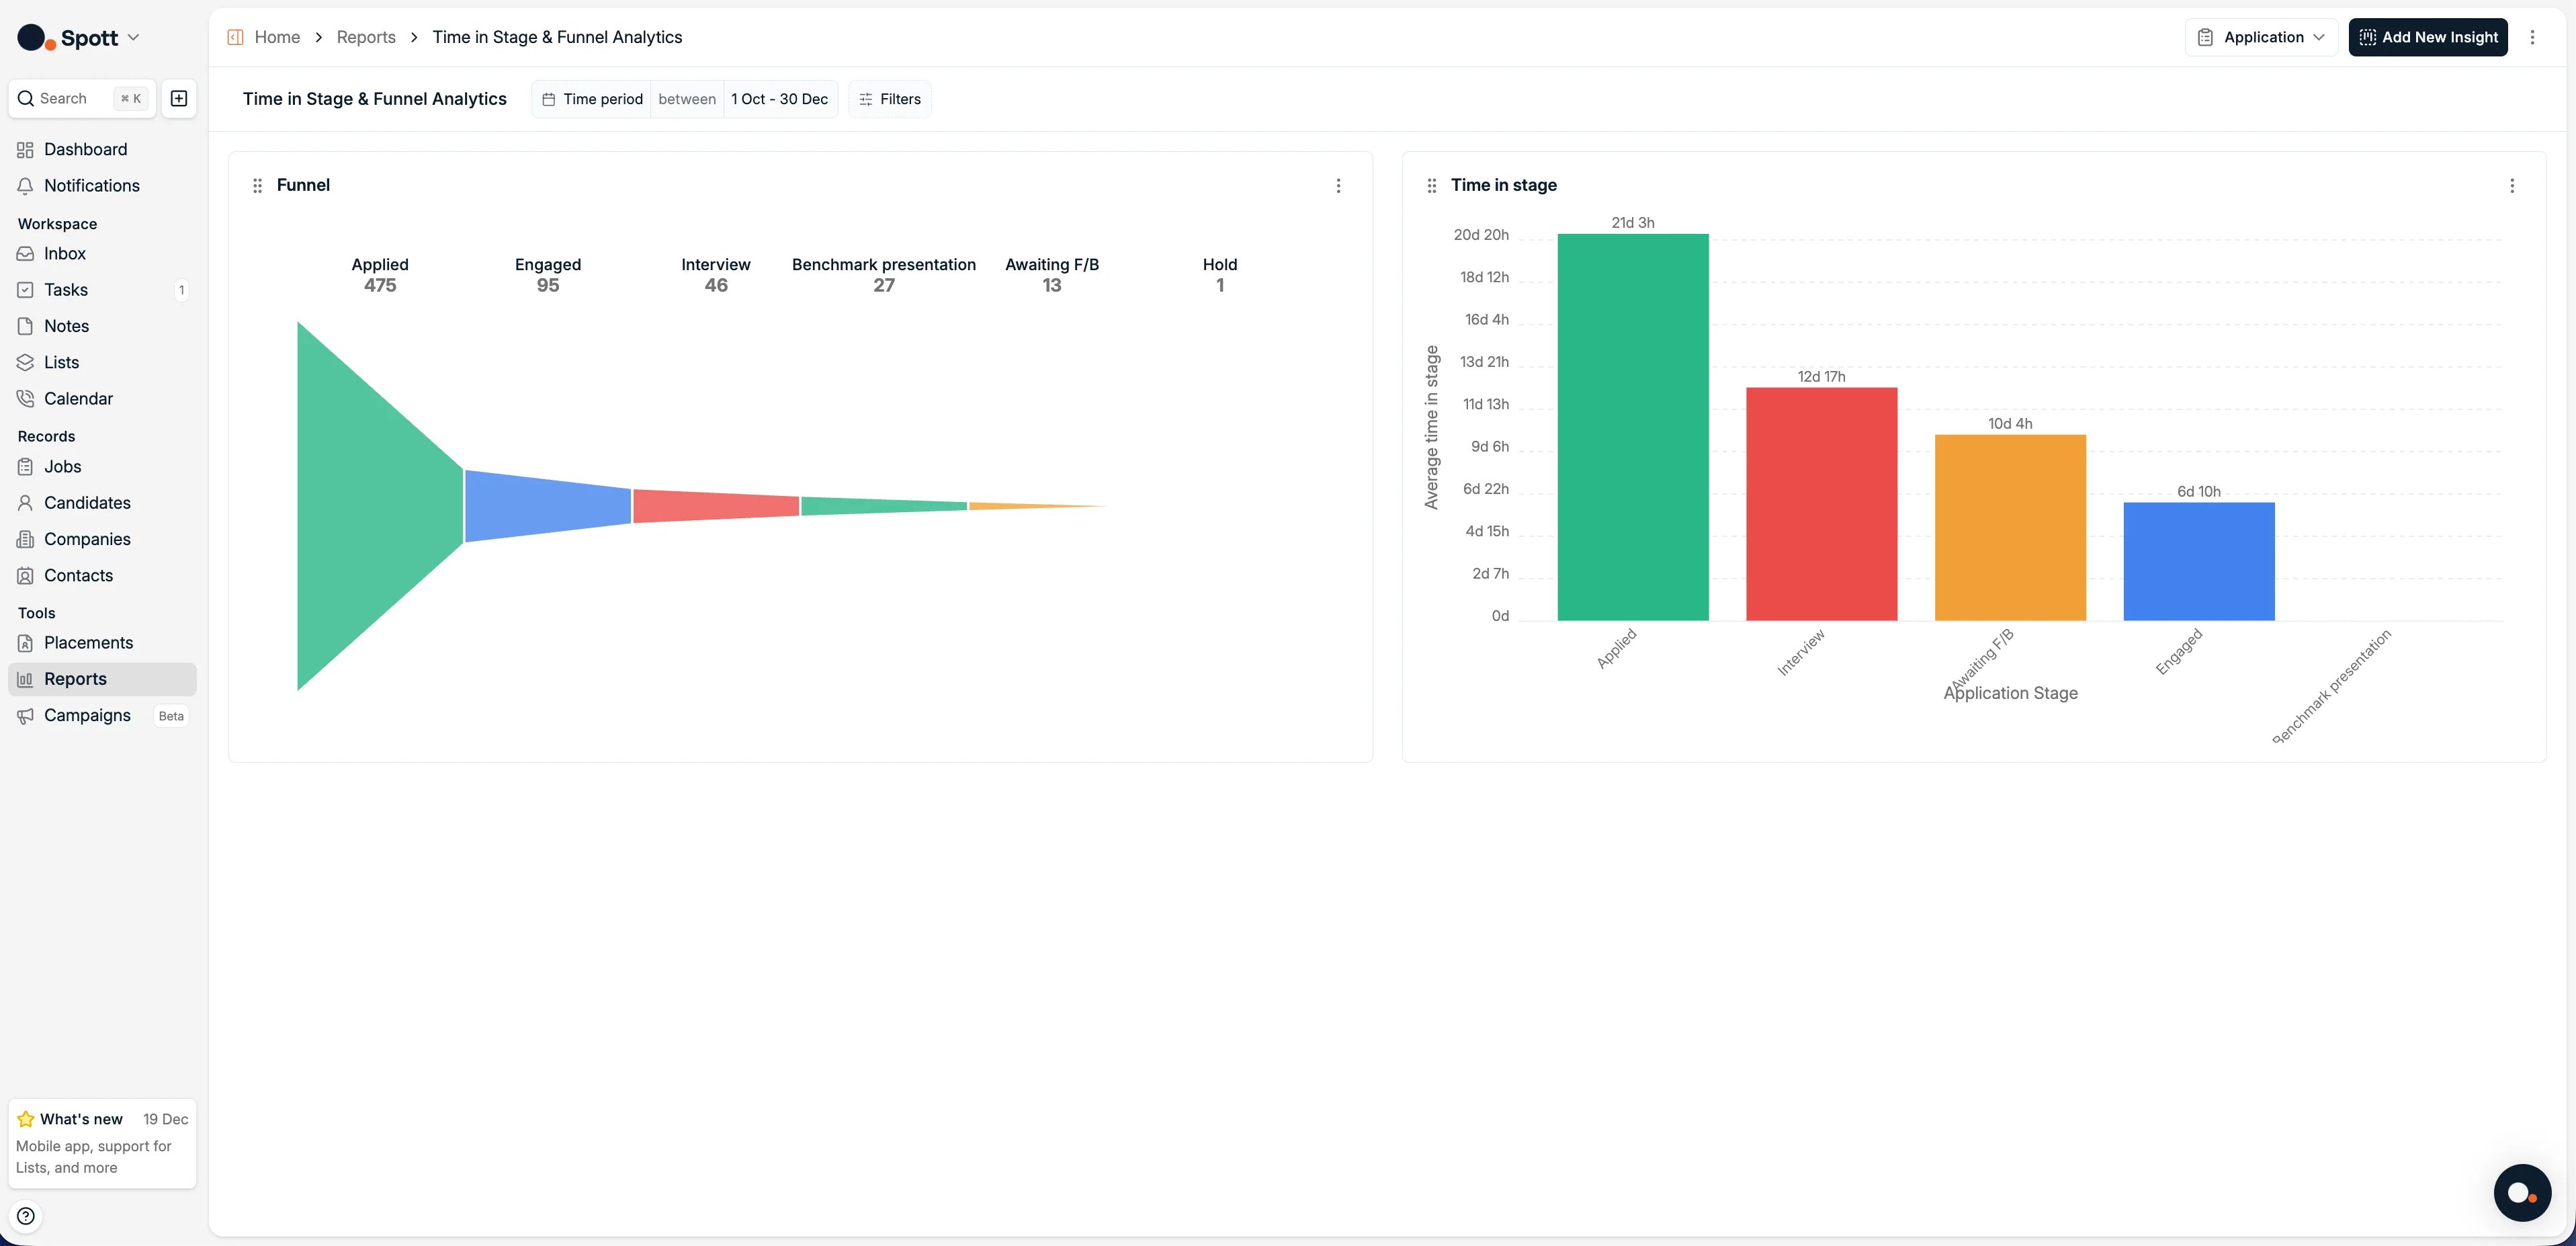
- Funnel: see how records convert from one pipeline stage to the next.
- Time in stage: measure how long records stay in each stage.
2.4 Add metrics, filters, grouping, and targets
Finish the insight by deciding exactly what it counts and which records are included:- Metrics: what the insight counts. Select Add metric to compare several measures in the same insight.
- Filters: select Add filter to narrow this insight by attributes, custom attributes, team, team member, or its own time period. Unlike the report-wide period selector, this filter applies to the insight only.
- Group by: for a Pivot insight, split the result by an attribute such as stage, company, or team member.
- Target: switch on a target and enter a number to show progress towards a goal, and when it has been reached.
2.5 Edit, duplicate, export, or delete an insight
Open the ⋮ menu on an insight to:- Edit: change its source, metrics, filters, grouping, target, or visualisation.
- Duplicate: use the insight as a starting point for a similar question.
- Export as Excel: download the chart data, and optionally select Include drilldown data to include the underlying records.
- Delete: remove the insight from the report.
Reports use live data, but they cannot currently be scheduled or emailed automatically.
Building reports
Data sources, insight types, metrics, filters, grouping, targets, and exports.
Reports reference
The Reports overview, ready-made reports, drilldowns, and visibility.
Managing access
Control which roles can view, manage, and export reports.
3. Use report examples as a starting point
These examples show the kind of question a focused report can answer. Adapt their insights to the data and targets that matter to your team.3.1 Candidate report
Use a candidate report to understand the composition and current status of your database:- Availability: how many candidates are available now or later.
- Education: candidates compared by education level.
- Employment type: the kinds of work candidates are looking for.
3.2 Team performance report
Use a user report to compare individual and team productivity:- Recorded activity: notes and applications created per user.
- Meetings: how many meetings the team holds each week.
- Commercial output: placement revenue and job creation.
3.3 Client report
Use a company report to understand the size of your client base, and where companies sit in your commercial pipeline.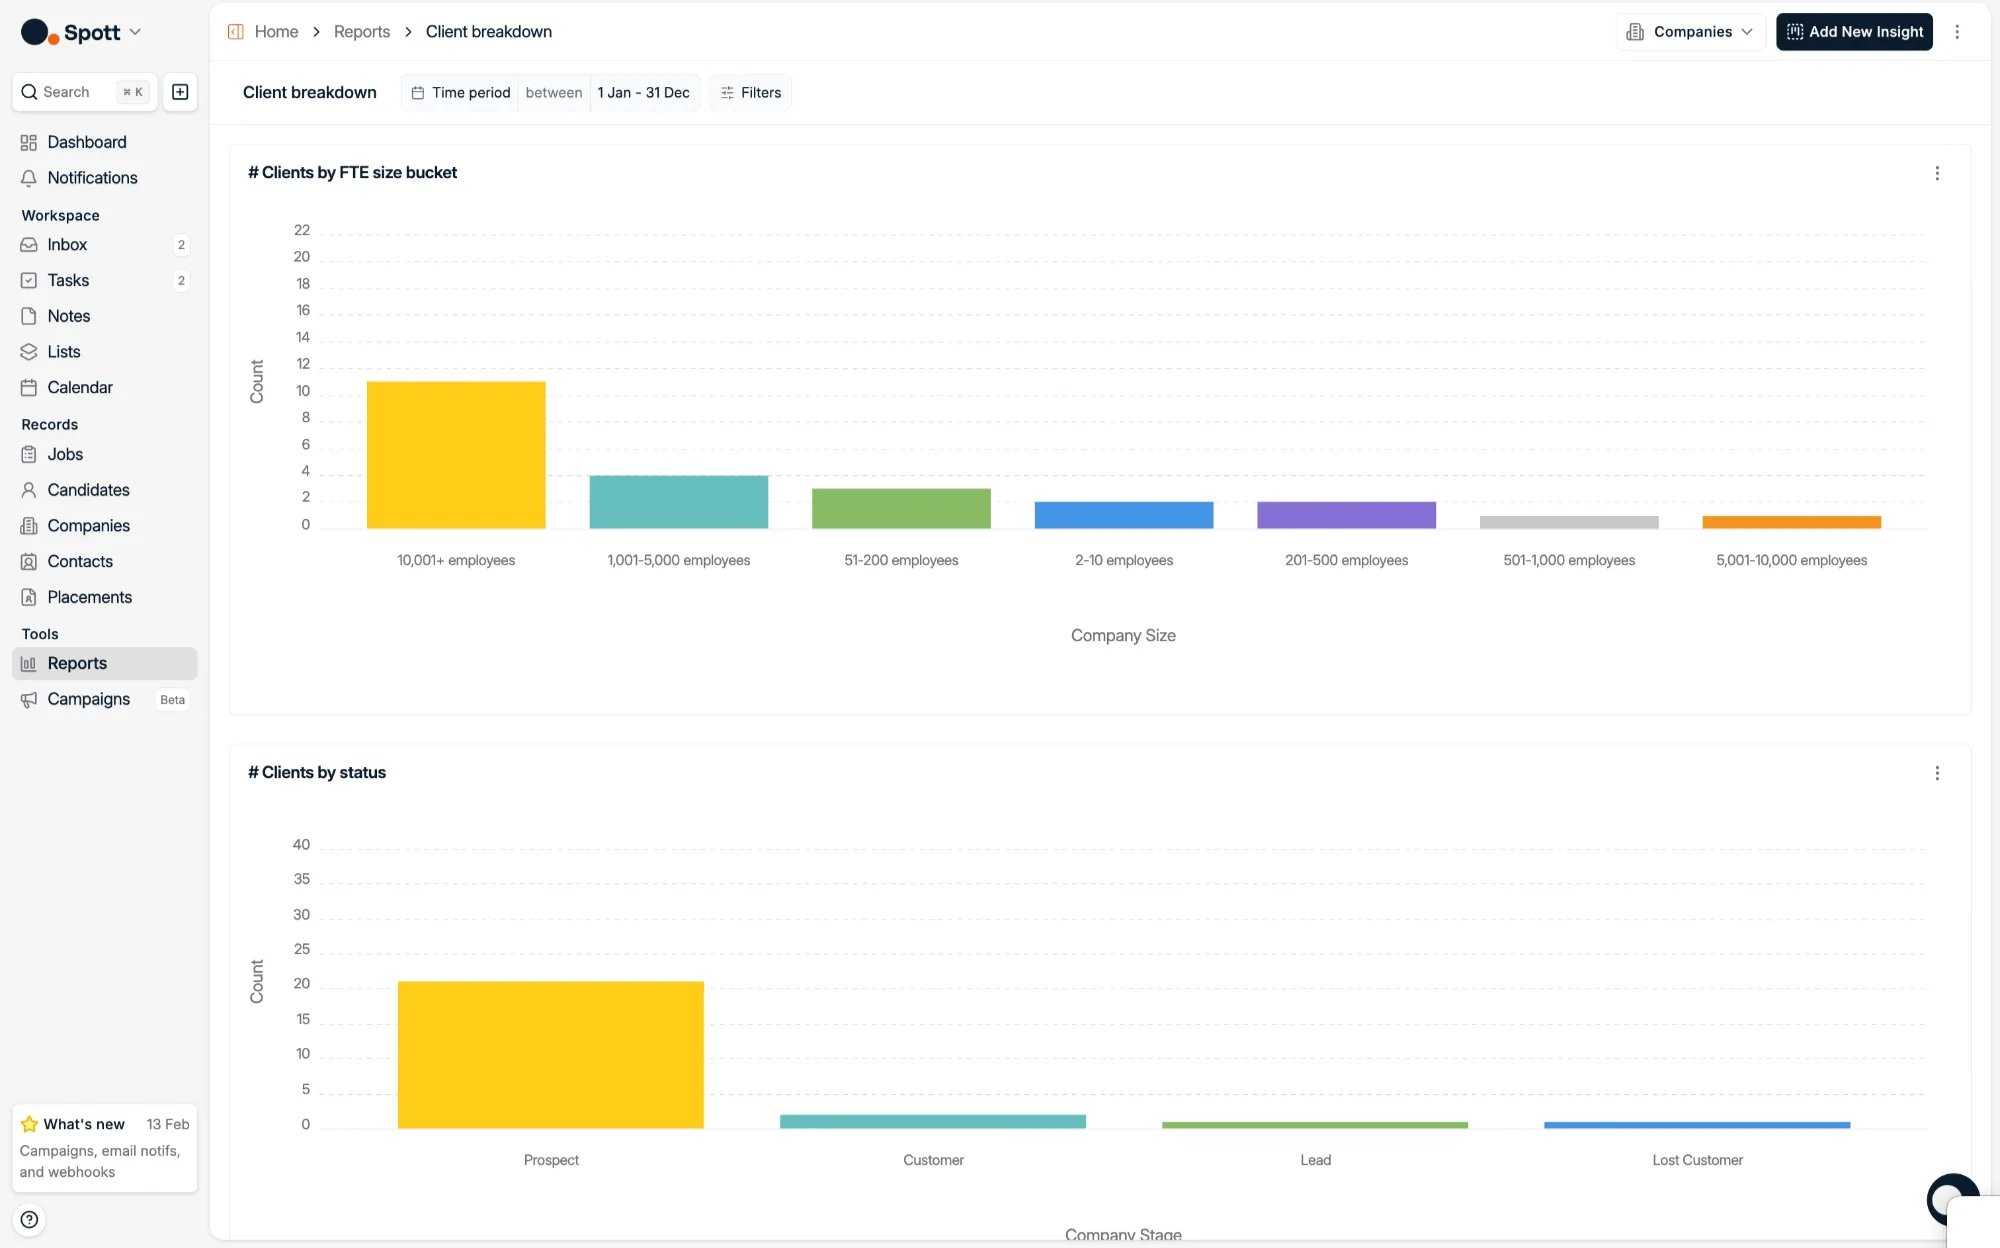
3.4 Application funnel report
Use an application report to see how many candidates are in each stage for a specific job, and how long they stay there. This is how you find the stages where applications slow down or drop out.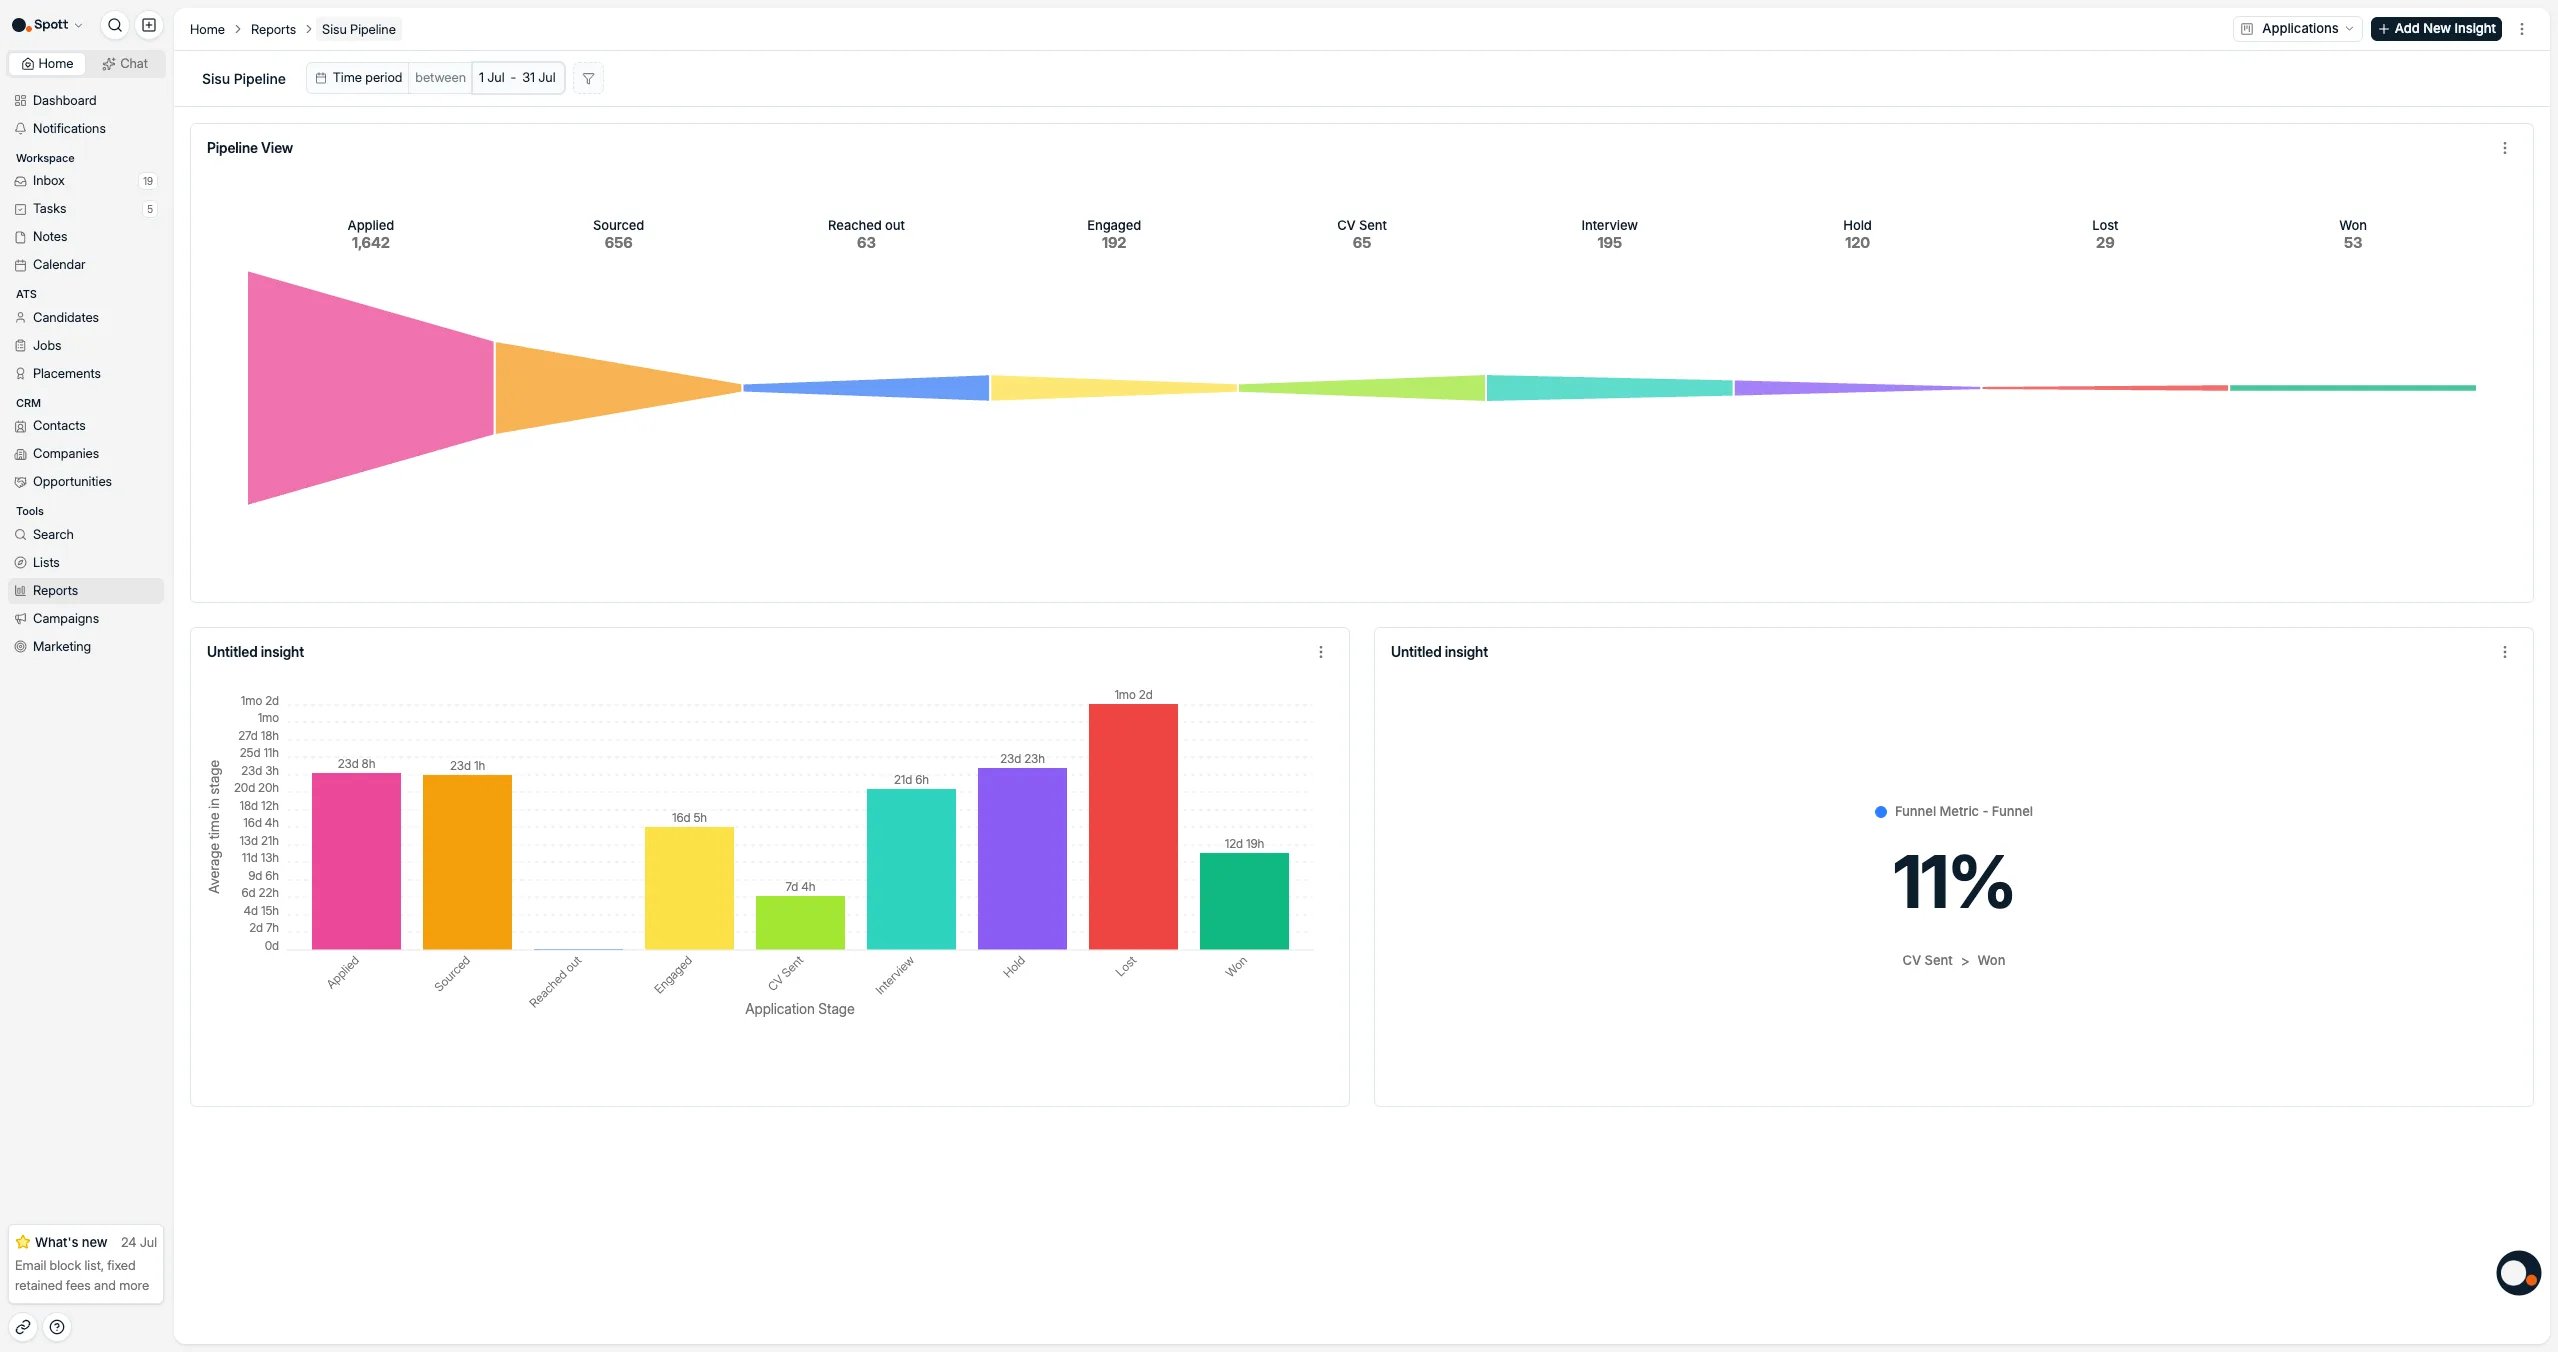
Now your turn
- Create a report on candidates, with two insights
- Create a report on applications, with two insights
- Create a report on placements, with two insights
Next: best practices
Build the habits that make your Spott data more useful over time.