> ## Documentation Index
> Fetch the complete documentation index at: https://docs.spott.io/llms.txt
> Use this file to discover all available pages before exploring further.
# Building Reports
> Build custom reports from live data: pick a data source, an insight type, and a visualization, then filter, group, and set targets.
While the [Dashboard](/docs/get-started/dashboard) shows a fixed set of activity
metrics, **Reports** is the fully custom builder: you choose what to count, how to
slice it, and how to draw it. Every number stays live, reading directly from your
workspace data. You find Reports in the left navigation under **Tools**.
A report is made up of one or more **insights**. Each insight answers one question,
for example "how many jobs did we add per stage" or "how many Reference Gained notes
did the team log this month". Create a report with **New Report**, then click
**Add New Insight** to fill it. A report also has its own **Time period** filter
that applies across its insights.
Every workspace starts with three ready-made reports: **Client breakdown** (on
companies), **Candidates overview**, and **Team performance** (on users, including
fee income per user and a sortable team leaderboard). Use them as they are, or
duplicate an insight as a starting point for your own.
## Configuring an insight
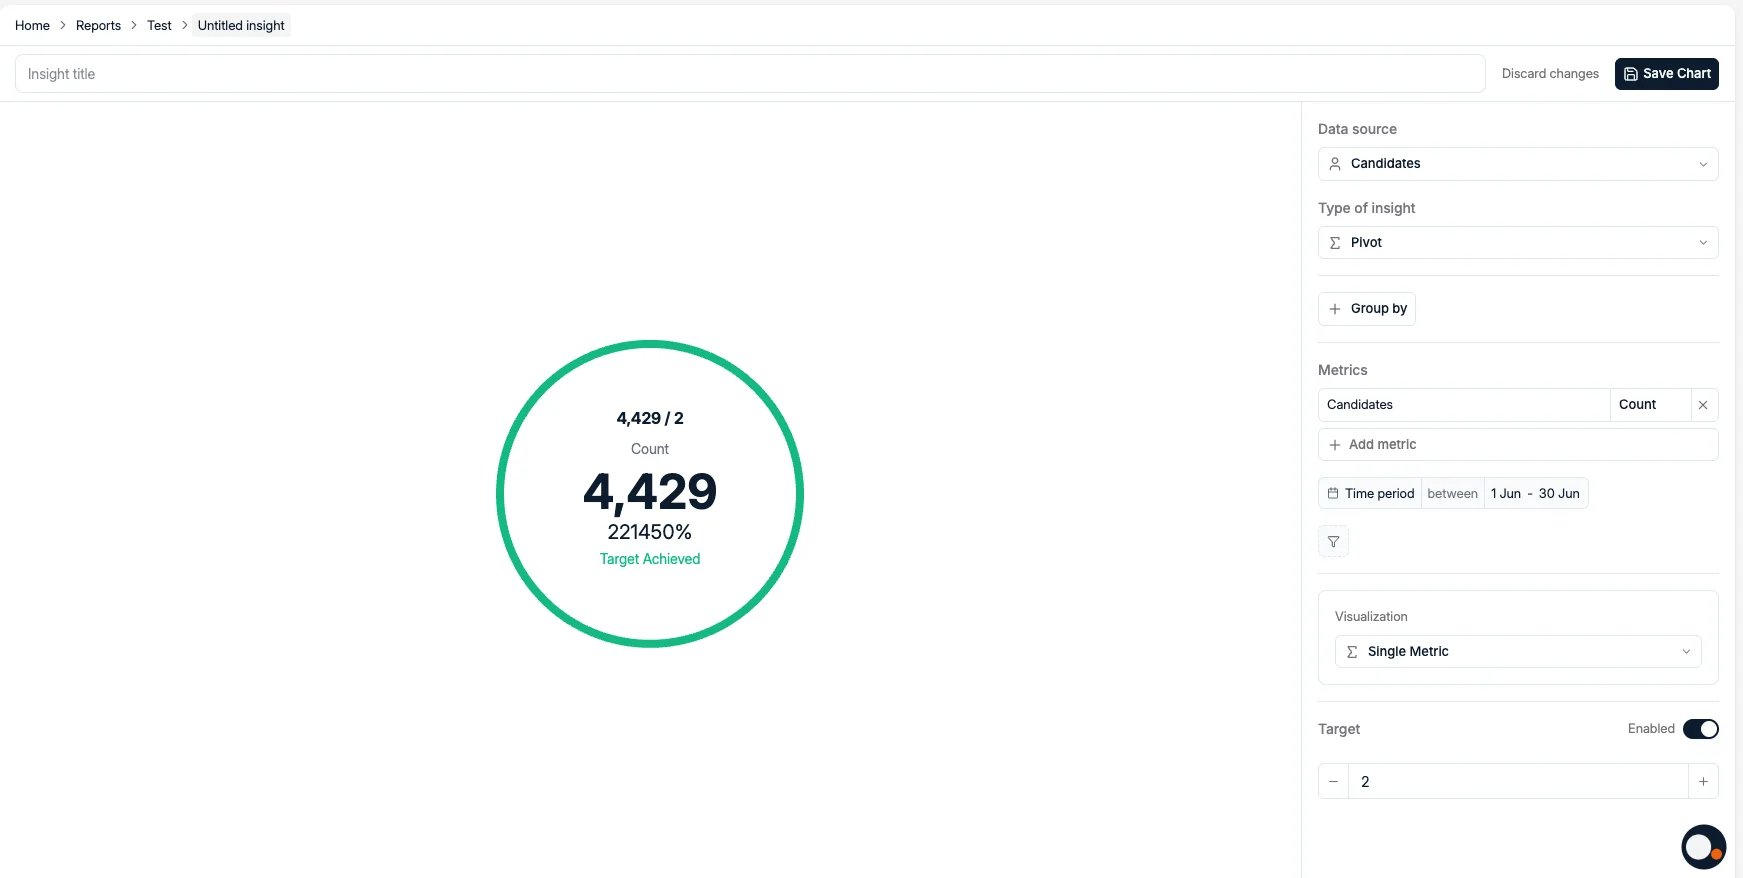
Give the insight a title, configure it in the right-hand panel while the left side
previews the live result, and click **Save Chart** when you are done.
 You build an insight by making four choices:
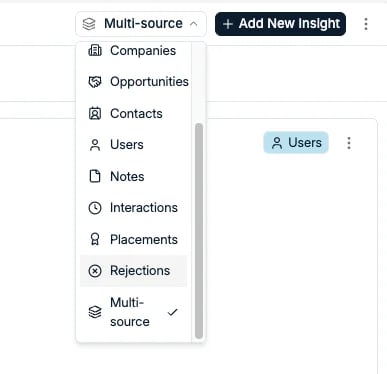
1. **Data source**: the record type the insight reports on: Candidates, Jobs,
Applications, Companies, Opportunities, Contacts, Users, Notes, Interactions,
Placements, or Rejections. Pick **Multi-source** to combine several record types
in one view.
2. **Type of insight**: how the data is measured.
3. **Metrics**: what is counted. An insight can hold multiple metrics; click **Add
metric** to compare counts side by side, for example all Notes next to Manual
Notes Created.
4. **Visualization**: how the result is drawn.
You build an insight by making four choices:
1. **Data source**: the record type the insight reports on: Candidates, Jobs,
Applications, Companies, Opportunities, Contacts, Users, Notes, Interactions,
Placements, or Rejections. Pick **Multi-source** to combine several record types
in one view.
2. **Type of insight**: how the data is measured.
3. **Metrics**: what is counted. An insight can hold multiple metrics; click **Add
metric** to compare counts side by side, for example all Notes next to Manual
Notes Created.
4. **Visualization**: how the result is drawn.
 ### Types of insight
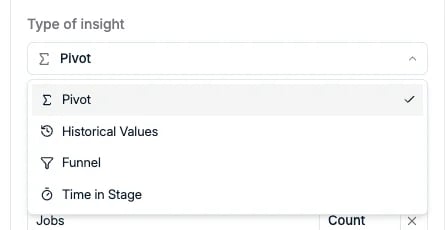 * **Pivot**: break a metric down across a dimension with **Group by**, for example
jobs per stage, per company, or per team member.
* **Historical Values**: track how a metric evolves over time.
* **Funnel**: see how records convert from one pipeline stage to the next.
* **Time in Stage**: measure how long records sit in each stage.
The available insight types depend on the data source. Funnel and Time in Stage
rely on pipeline stage data, so they are offered for stage-based sources such as
**Applications** and **Jobs**. For sources without stages, like Candidates, only
Pivot and Historical Values are available.
### Visualizations
* **Pivot**: break a metric down across a dimension with **Group by**, for example
jobs per stage, per company, or per team member.
* **Historical Values**: track how a metric evolves over time.
* **Funnel**: see how records convert from one pipeline stage to the next.
* **Time in Stage**: measure how long records sit in each stage.
The available insight types depend on the data source. Funnel and Time in Stage
rely on pipeline stage data, so they are offered for stage-based sources such as
**Applications** and **Jobs**. For sources without stages, like Candidates, only
Pivot and Historical Values are available.
### Visualizations
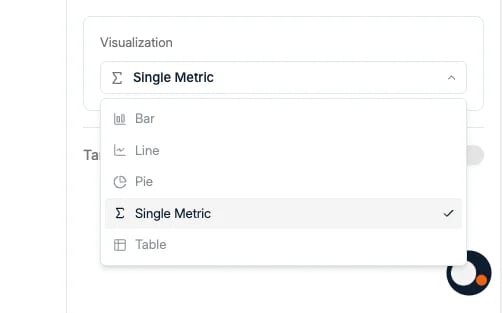 Draw the result as a **Bar**, **Line**, or **Pie** chart, a **Table**, or a
**Single Metric** headline number.
### Filters, grouping, and targets
Click **Add filter** to narrow down which records count. You can filter on the data
source's attributes, including any [custom attributes](/docs/settings/customizing-candidate-profiles)
you created, plus **Team** and **Team Member** to scope an insight to part of your
organization. A **Time period** filter restricts the insight to a date range.
For **Pivot** insights, **Group by** splits the result across any attribute of the
data source.
Each insight can also have a **Target**: enable it and set a number, and the insight
shows your progress against that goal as a percentage, with a **Target Achieved**
state once you pass it.
## Tracking activity with note labels
To report on logged activity such as calls, client meetings, or references, report
on **Notes** and filter by [note label](/docs/settings/labels).
Draw the result as a **Bar**, **Line**, or **Pie** chart, a **Table**, or a
**Single Metric** headline number.
### Filters, grouping, and targets
Click **Add filter** to narrow down which records count. You can filter on the data
source's attributes, including any [custom attributes](/docs/settings/customizing-candidate-profiles)
you created, plus **Team** and **Team Member** to scope an insight to part of your
organization. A **Time period** filter restricts the insight to a date range.
For **Pivot** insights, **Group by** splits the result across any attribute of the
data source.
Each insight can also have a **Target**: enable it and set a number, and the insight
shows your progress against that goal as a percentage, with a **Target Achieved**
state once you pass it.
## Tracking activity with note labels
To report on logged activity such as calls, client meetings, or references, report
on **Notes** and filter by [note label](/docs/settings/labels).
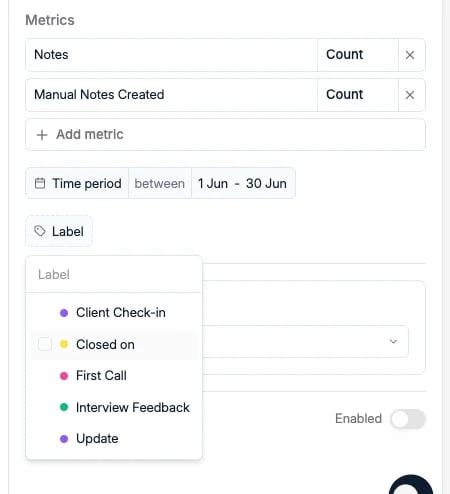 If your team logs activities as notes with a consistent label, for example First
Call, Client Check-in, or Interview Feedback, you can count exactly how often each
activity happens, per period and per person. Coming from another ATS, this replaces
comment types or activity types: create a note label per activity, then build a
Notes insight filtered on that label.
For clean reporting, agree on a small, fixed set of note labels up front.
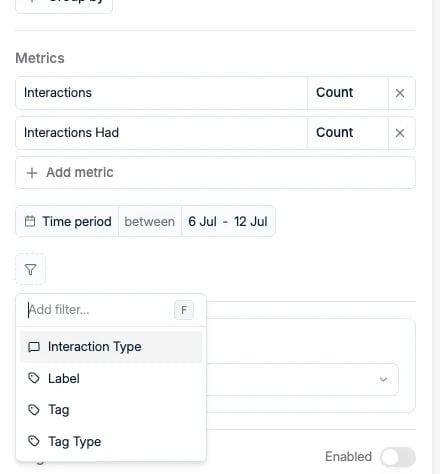
For touchpoints Spott records automatically, use the **Interactions** data source
instead. It covers two-way [interactions](/docs/candidates/last-interaction) such
as emails, LinkedIn messages, phone calls, and calendar meetings, and can be
filtered by **Interaction Type**, **Label**, **Tag**, or **Tag Type**.
If your team logs activities as notes with a consistent label, for example First
Call, Client Check-in, or Interview Feedback, you can count exactly how often each
activity happens, per period and per person. Coming from another ATS, this replaces
comment types or activity types: create a note label per activity, then build a
Notes insight filtered on that label.
For clean reporting, agree on a small, fixed set of note labels up front.
For touchpoints Spott records automatically, use the **Interactions** data source
instead. It covers two-way [interactions](/docs/candidates/last-interaction) such
as emails, LinkedIn messages, phone calls, and calendar meetings, and can be
filtered by **Interaction Type**, **Label**, **Tag**, or **Tag Type**.
 ## Drilling down
Numbers on a report are clickable: click one to open the exact records behind it,
so you can see what is driving a metric instead of trusting the total on its own.
## Managing and exporting insights
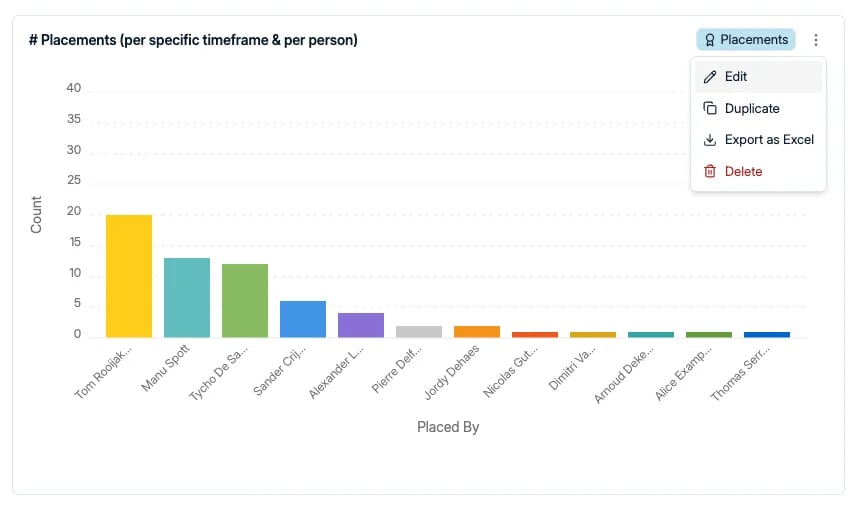
Open the **⋮ menu** on any insight to **Edit**, **Duplicate**, **Export as Excel**,
or **Delete** it.
## Drilling down
Numbers on a report are clickable: click one to open the exact records behind it,
so you can see what is driving a metric instead of trusting the total on its own.
## Managing and exporting insights
Open the **⋮ menu** on any insight to **Edit**, **Duplicate**, **Export as Excel**,
or **Delete** it.
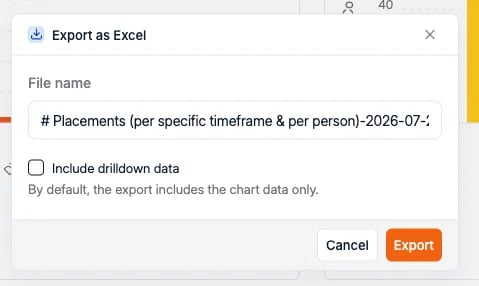
 When exporting, you can name the file and optionally tick **Include drilldown
data**; by default the export contains the chart data only.
When exporting, you can name the file and optionally tick **Include drilldown
data**; by default the export contains the chart data only.
 There is currently no scheduled or emailed report delivery.
## Sharing
The Reports overview has two sections: **Your reports**, visible only to you, and a
workspace section **visible to everyone**. There is no team-level sharing tier in
between.
Who can view, manage, and export reports is controlled per role from
**Settings → Security**. See [managing access](/docs/settings/managing-access).
There is currently no scheduled or emailed report delivery.
## Sharing
The Reports overview has two sections: **Your reports**, visible only to you, and a
workspace section **visible to everyone**. There is no team-level sharing tier in
between.
Who can view, manage, and export reports is controlled per role from
**Settings → Security**. See [managing access](/docs/settings/managing-access).