> ## Documentation Index
> Fetch the complete documentation index at: https://docs.spott.io/llms.txt
> Use this file to discover all available pages before exploring further.
# Using the Dashboard
> Get an overview of your performance, pipeline, and daily activity in one central place.
You can quickly navigate to the Dashboard with `G` then `D`. See all
[keyboard shortcuts](/docs/settings/keyboard-shortcuts).
The Dashboard gives you a real-time snapshot of your recruitment activity, from
revenue and calls to open jobs and candidate progress. It is your personal home
screen when opening Spott.
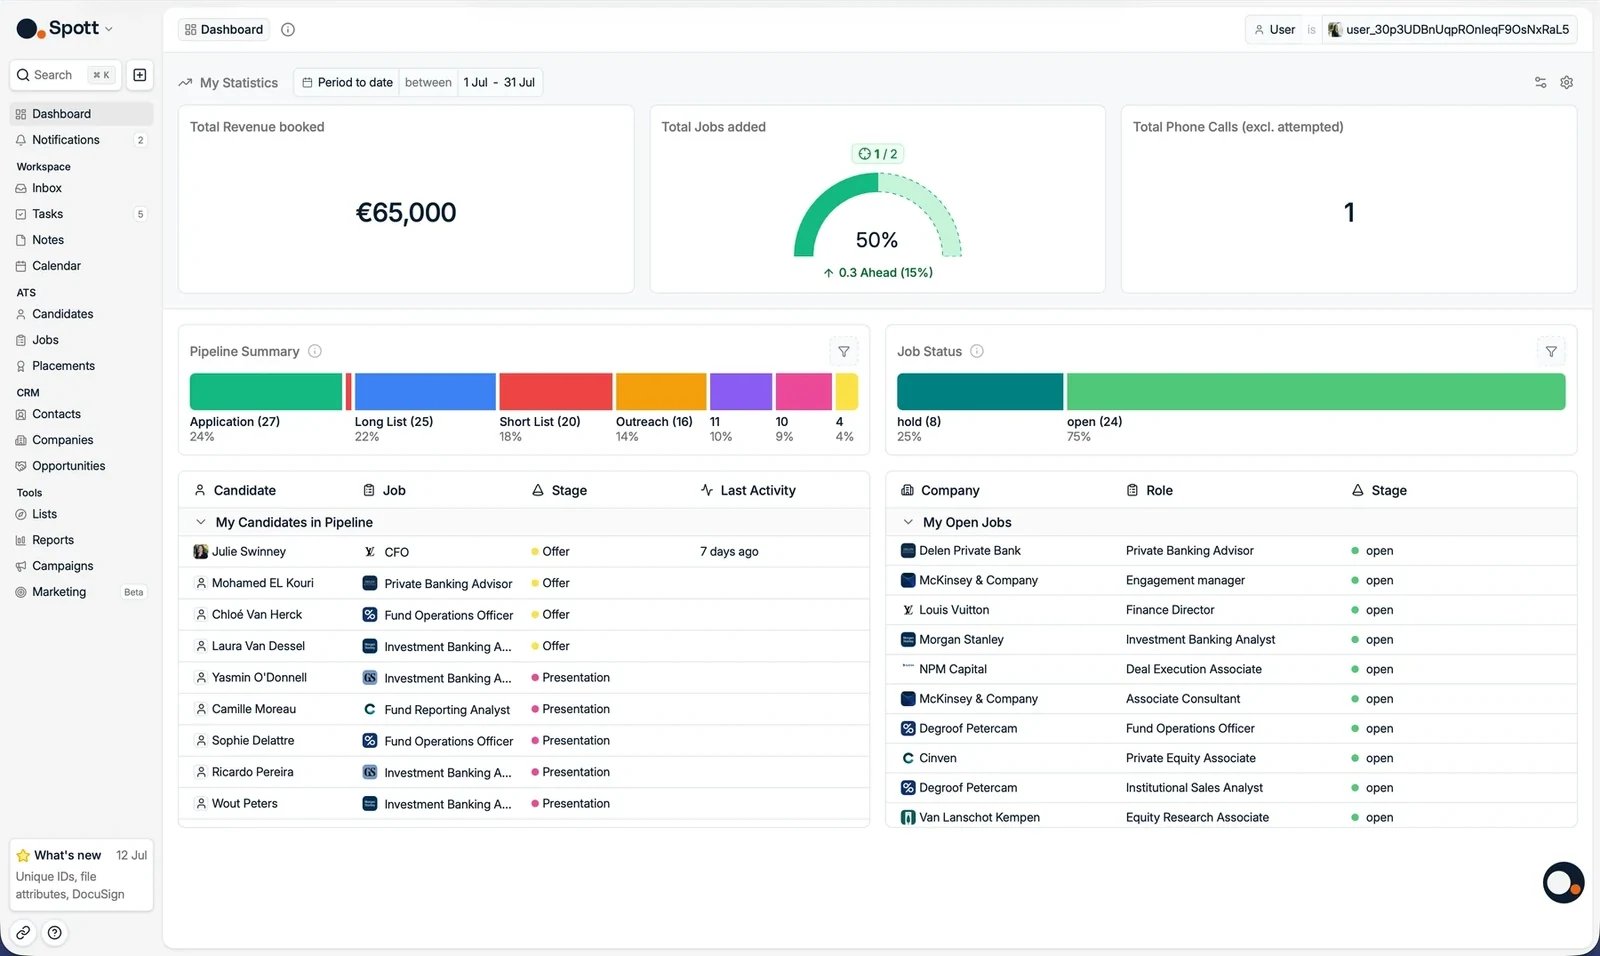 ## My Statistics
Use the **user filter** to choose whose numbers you see (you or teammates) and the
**time period filter** on the top right to set the reporting period (for example
This week, This month, This quarter, or a custom range).
The metric cards show key performance numbers for the period. Open **Configure
Dashboard** to choose which metrics appear and drag them into the order you want. The
available metrics are:
* **Total Revenue booked**, **Total Placements added**
* **Total Jobs added**, **Total Candidates added**
* **Total Phone Calls (excl. attempted)**, **Total Outbound Calls**
* **Total Online Meetings**, **Total In-person Meetings**
* **Total CVs sent**, **Total Standard CVs sent**, **Total Speculative CVs sent**
* **Total 1st Interviews**, **Total 1st Standard Interviews**,
**Total 1st Speculative Interviews**
* **CV Sent Fill Rate**, **1st Interview Fill Rate**
Configure Dashboard is **workspace-wide**: the metrics you turn on or off affect
everybody's dashboards, not just your own.
## My Statistics
Use the **user filter** to choose whose numbers you see (you or teammates) and the
**time period filter** on the top right to set the reporting period (for example
This week, This month, This quarter, or a custom range).
The metric cards show key performance numbers for the period. Open **Configure
Dashboard** to choose which metrics appear and drag them into the order you want. The
available metrics are:
* **Total Revenue booked**, **Total Placements added**
* **Total Jobs added**, **Total Candidates added**
* **Total Phone Calls (excl. attempted)**, **Total Outbound Calls**
* **Total Online Meetings**, **Total In-person Meetings**
* **Total CVs sent**, **Total Standard CVs sent**, **Total Speculative CVs sent**
* **Total 1st Interviews**, **Total 1st Standard Interviews**,
**Total 1st Speculative Interviews**
* **CV Sent Fill Rate**, **1st Interview Fill Rate**
Configure Dashboard is **workspace-wide**: the metrics you turn on or off affect
everybody's dashboards, not just your own.
 You can also set **targets** per metric with Configure Dashboard Targets. The cards
show how you are tracking against them. Click a metric card to **drill down** into
the underlying records.
The Dashboard metrics are a fixed set. If you want to count something the cards
do not cover, for example notes with a specific label, build a custom insight in
[Reports](/docs/get-started/reports).
You can also set **targets** per metric with Configure Dashboard Targets. The cards
show how you are tracking against them. Click a metric card to **drill down** into
the underlying records.
The Dashboard metrics are a fixed set. If you want to count something the cards
do not cover, for example notes with a specific label, build a custom insight in
[Reports](/docs/get-started/reports).
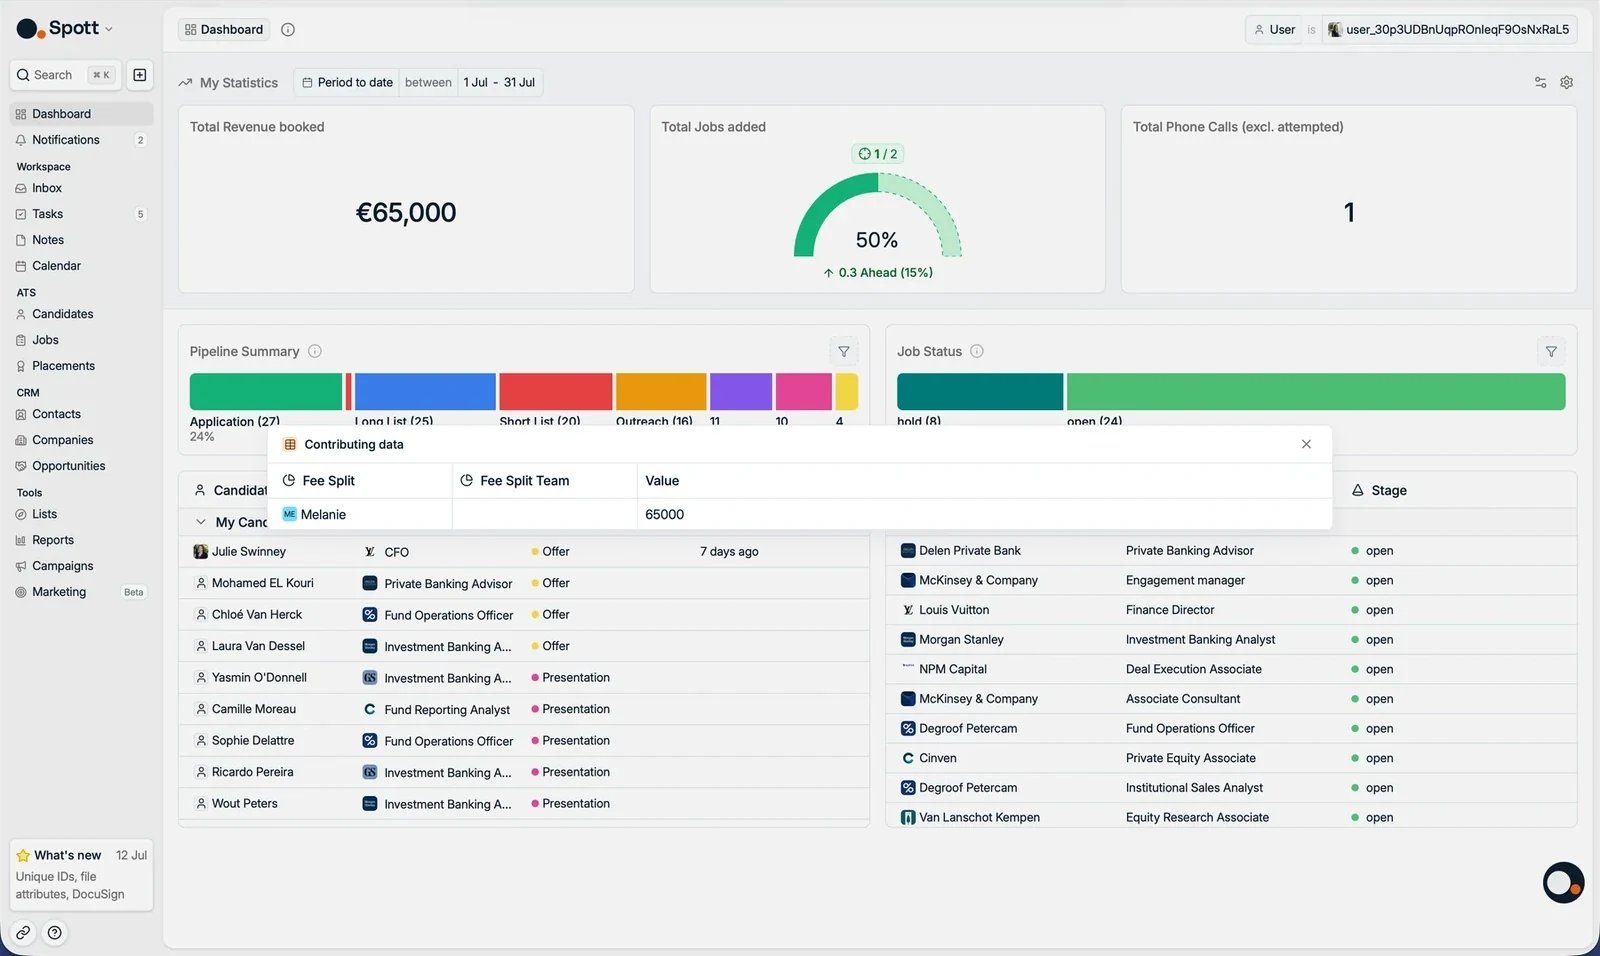 ## Pipeline Summary and Job Status
* **Pipeline Summary** shows the applications you own, per stage.
* **Job Status** shows the jobs you are on the team of, broken down by status.
Both are clickable: select a stage to see who is behind the number.
## My Candidates in Pipeline
Summarizes all candidates you are currently managing across job stages. Each row
shows the candidate, the job and client, and the current stage. Click a row to open
the application.
## My Open Jobs
Lists the active positions you own or collaborate on. Click a job to go to its
record.
The Dashboard updates in real time as you log calls, add candidates, or move them
through stages.
## Pipeline Summary and Job Status
* **Pipeline Summary** shows the applications you own, per stage.
* **Job Status** shows the jobs you are on the team of, broken down by status.
Both are clickable: select a stage to see who is behind the number.
## My Candidates in Pipeline
Summarizes all candidates you are currently managing across job stages. Each row
shows the candidate, the job and client, and the current stage. Click a row to open
the application.
## My Open Jobs
Lists the active positions you own or collaborate on. Click a job to go to its
record.
The Dashboard updates in real time as you log calls, add candidates, or move them
through stages.